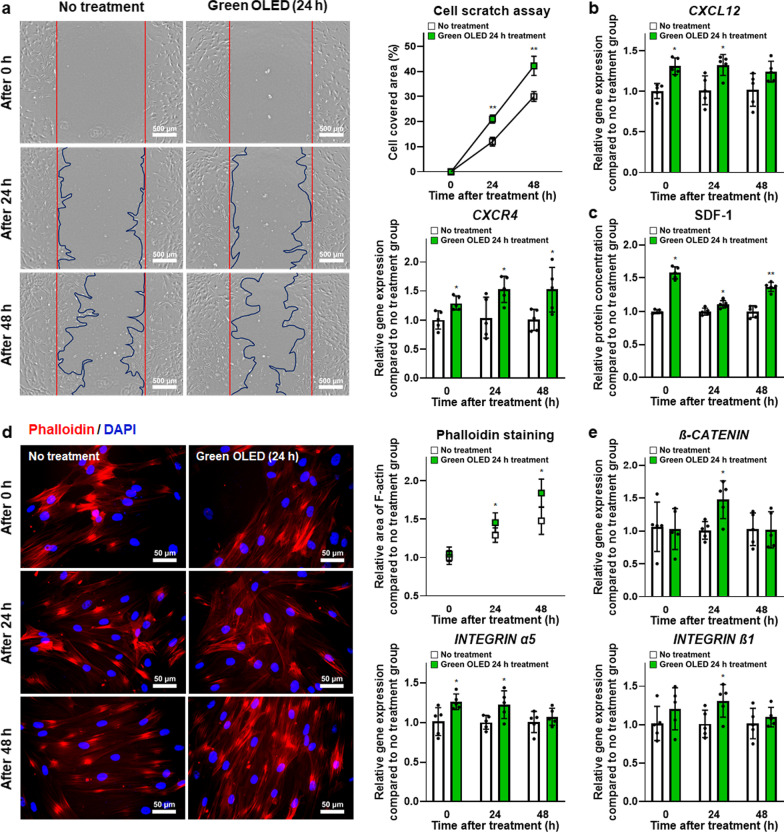
Fig. 5.
Enhanced migration and adhesion of green OLED-treated hADSCs. a Cell migration of hADSCs at 0, 24, and 48 h after green OLED irradiation for 24 h as evaluated by cell scratch assay (scale bar = 500 µm) with quantification results (n = 7). b Gene expression levels of CXCL12 and CXCR4 in hADSCs at 0, 24, and 48 h after green OLED irradiation for 24 h as evaluated by qRT-PCR (n = 5). c Secreted SDF-1 protein levels of hADSCs at 0, 24, and 48 h after green OLED irradiation for 24 h as evaluated by ELISA (n = 5). d Phalloidin staining (blue: nuclei, red: F-actin, scale bar = 50 µm) of hADSCs at 0, 24, and 48 h after green OLED irradiation for 24 h with quantification results (n = 6). e Gene expression levels of β-CATENIN, INTEGRIN α5, and INTEGRIN β1 in hADSCs at 0, 24, and 48 h after green OLED irradiation for 24 h as evaluated by qRT-PCR (n = 5). *p < 0.05; **p < 0.001 compared to no treatment group with unpaired t test

