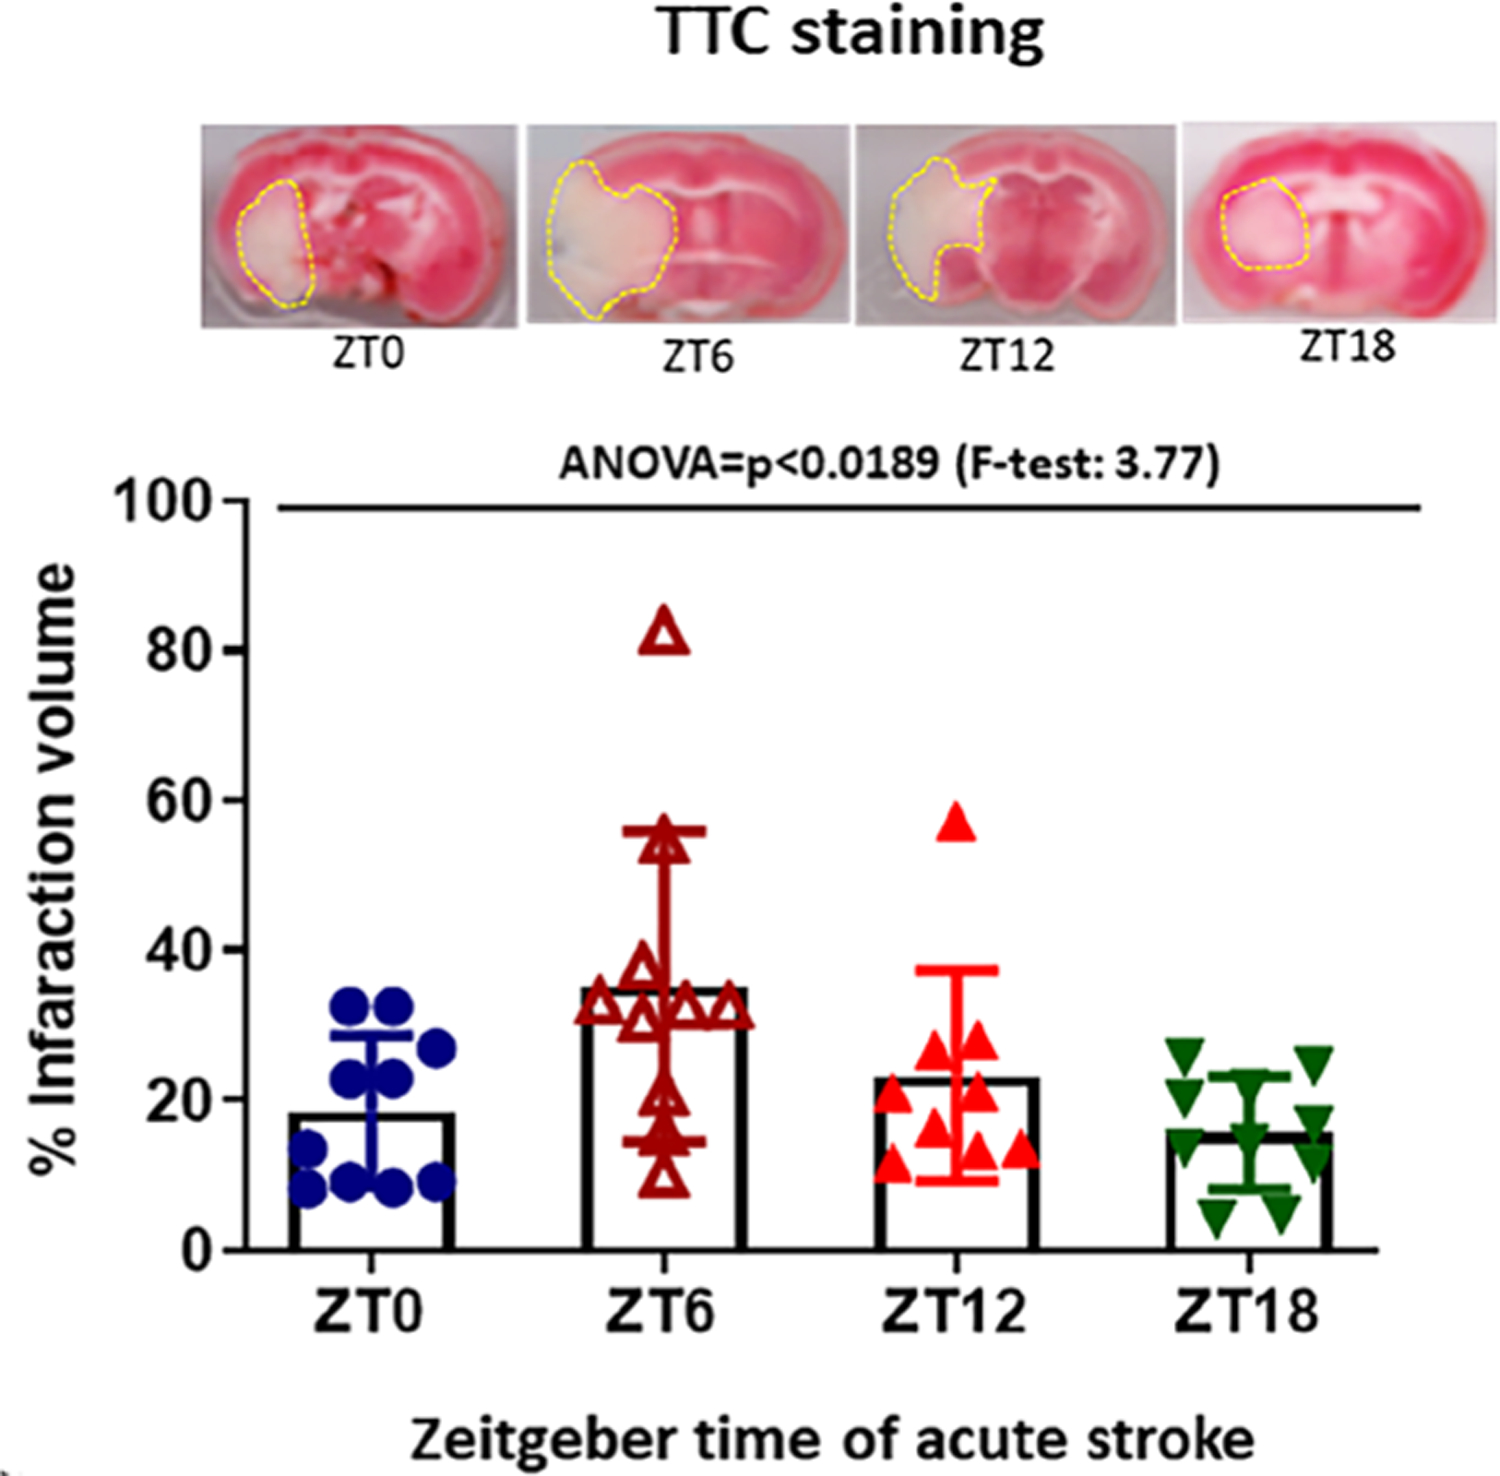
Figure.3:

The infarct volume was observed by TTC staining of brain slices from each time points of stroke induction. The viable tissue was stained red color by TTC staining, but the infarcted/dead area remains unstained, exhibiting pale yellow/white color. Quantitative evaluation of percent infarction volume in different cohorts of mice was observed at 48h after MCAO. ‡ Homogeneity of Variance was verified (F=1.43, 0.2511).
