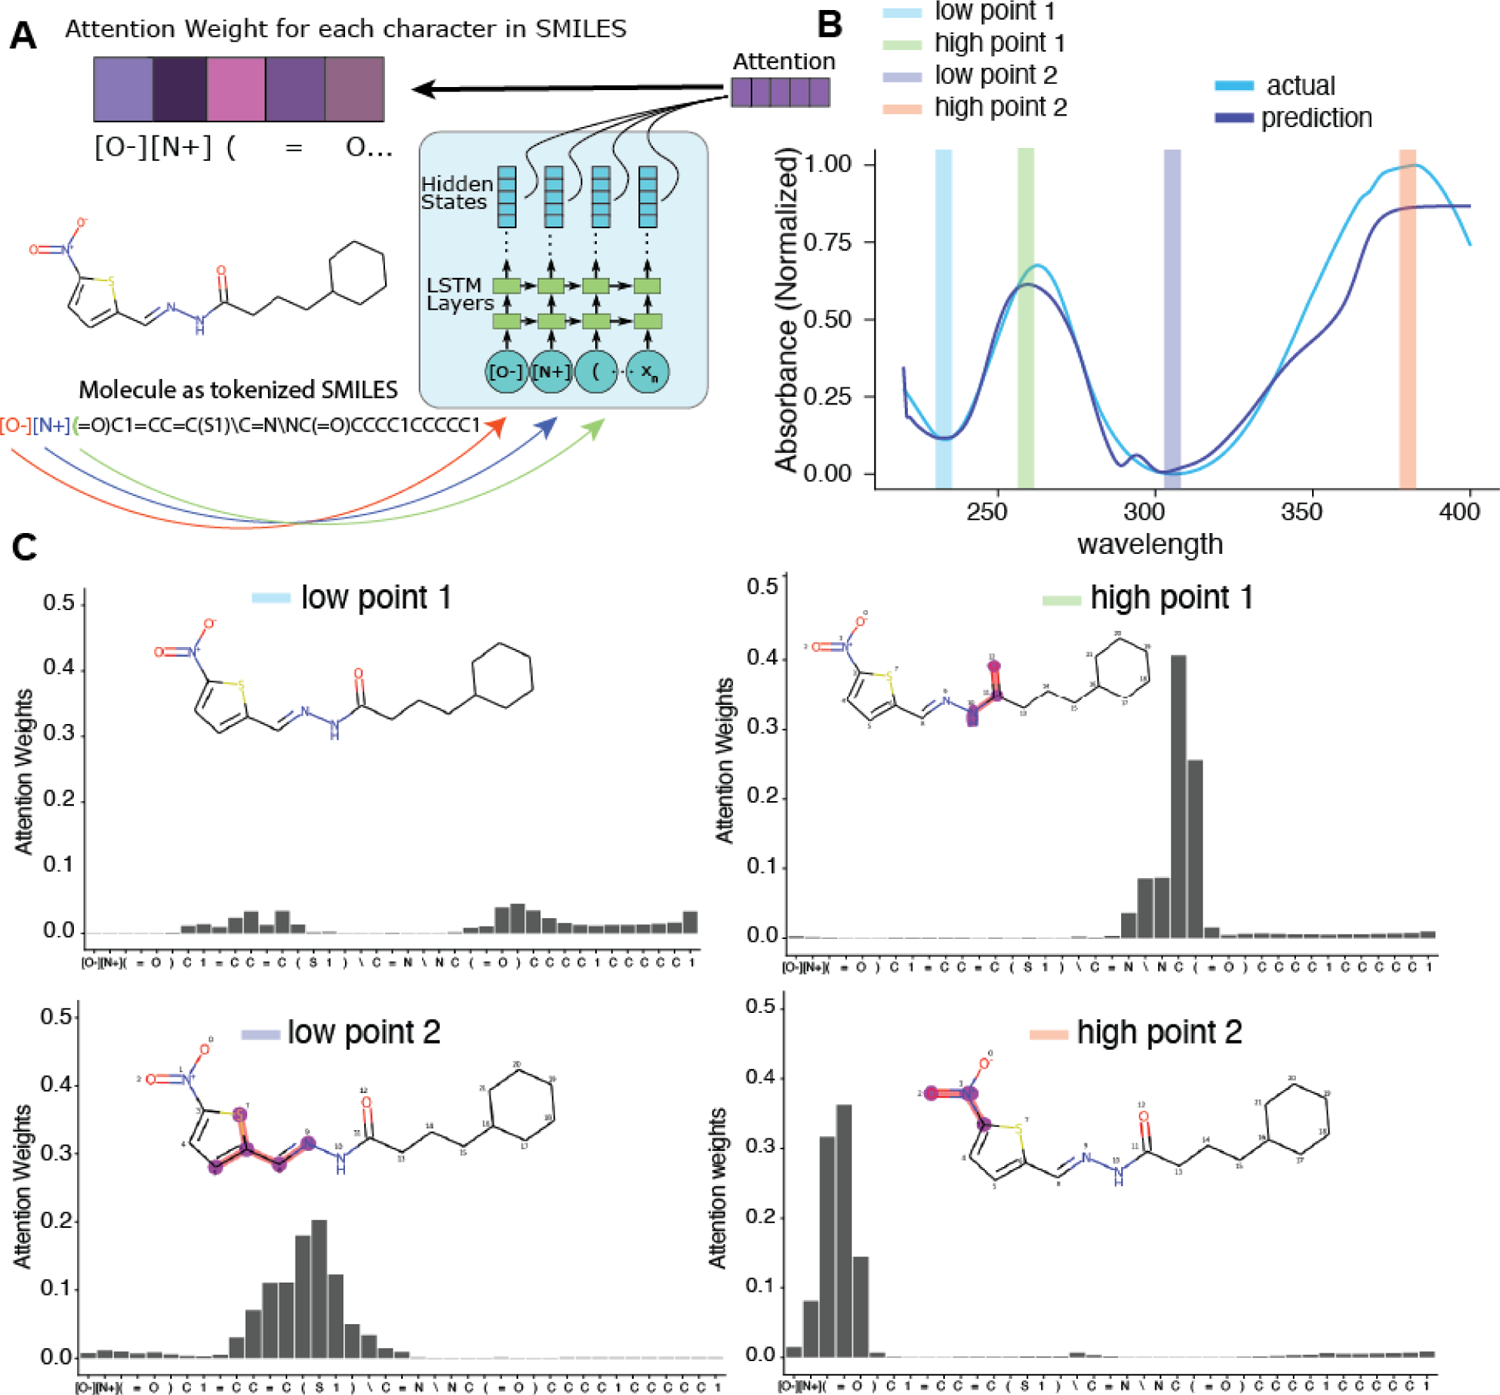
Figure 3:

Exploration of the Seq2Seq model’s attention weights. A. Graphic showing the encoder side of Seq2Seq and the generation of an attention weight vector for each tokenized SMILES input. B. Example spectra and selected wavelengths at which the attention weights are visualized. C. Attention weights for each token SMILES input for each of the four chose wavelengths. At each prediction step, the attention weights focus on the most relevant SMILES input token as represented by the weight value.
