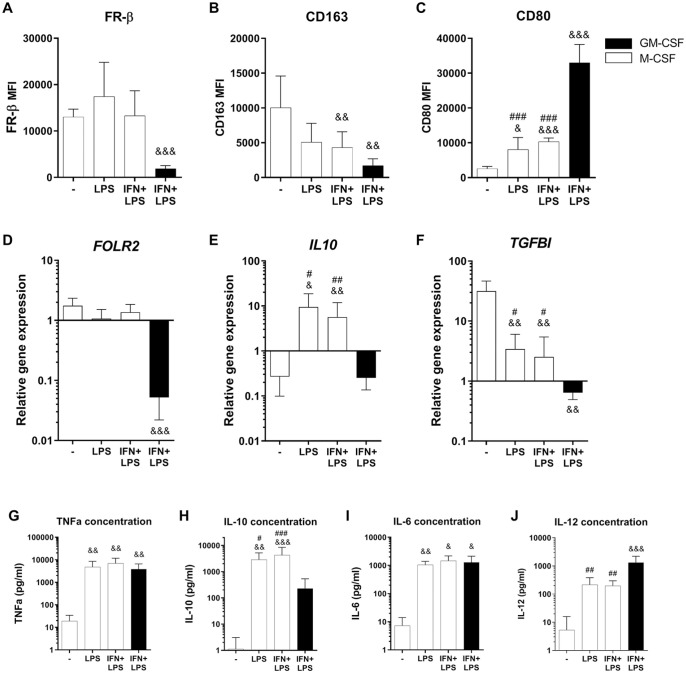
Figure 2.
Effects of inflammatory stimulation on FR-β surface expression in M-CSF macrophages. Experimental conditions consist of GM-CSF (black bars) or M-CSF (white bars) generated macrophages, stimulated for 24 hours with corresponding cytokine(s). (A-C) Mean fluorescence intensity (MFI) of FR-β, CD163, and CD80 as measured by flow cytometry. (D-F) Relative gene expression of FOLR2, IL10, and TGFBI, calculated using delta Ct method and housekeeping genes TBP and YWHAZ. (H-J) Cytokine concentration of TNF-α, IL-10, IL-6, and IL-12 in culture supernatants measured by ELISA. Graphs represent mean ± SD. &P < 0.05, &&P < 0.01, &&&P < 0.001 compared with M-CSF control; #P < 0.05, ##P < 0.01, ###P < 0.001 compared with M1(IFN+LPS), as determined by generalized linear mixed models with Bonferroni correction. FR-β = folate receptor beta; M-CSF = macrophage colony-stimulating factor; GM-CSF = granulocyte-macrophage colony-stimulating factor; TGFBI = transforming growth factor beta induced; TNF = tumor necrosis factor; IL = interleukin; IFN = interferon; LPS = lipopolysaccharide; ELISA = enzyme-linked immunosorbent assay.

