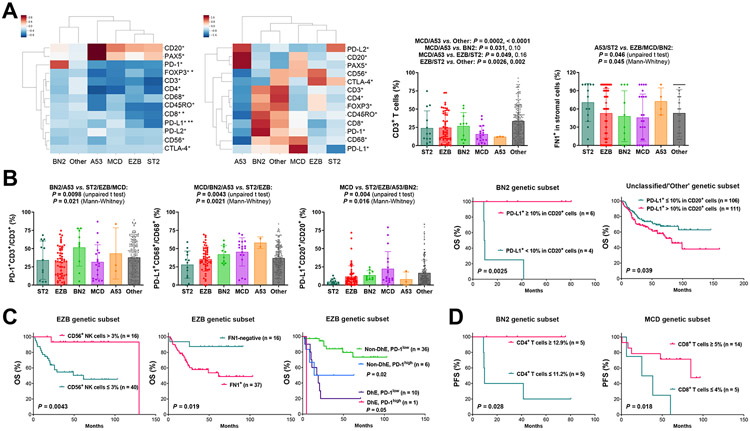
Fig. 2. Heterogeneity and prognostic effects of immune/microenvironment biomarkers in DLBCL genetic subsets.
(A) Left, a Z-score clustermap based on median immunofluorescence counts; the Z-score was computed for each phenotype count across all samples, and then the median Z-score was computed within each group. Significant differences between MCD and EZB subtypes by two-sided Mann-Whitney U test are marked by asterisks. *: P ≤ 0.05, **: P ≤ 0.01. Middle, a Z-score clustermap to show clusters based on mean cell counts for each group; the mean phenotype count was computed within each group, and then the Z-score was computed across all groups. Right, two scatter plots for T cell percentage and FN1 expression levels, respectively. T cell percentage was calculated by T cell counts divided by total counts of B cells, T cells, macrophages, and NK cells; two P values for each comparison are by unpaired t test and Mann-Whitney test, respectively, and statistically significant P values are in bold. (B) Left, three scatter plots for PD-1 expression in T cells and PD-L1 expression in macrophages and B cells in DLBCL genetic subtypes. In all scatter plots, each dot represents one patient; P values are 2-tailed (unpaired t and Mann-Whitney) and exact (Mann-Whitney). Right, PD-L1 expression in B-cells was significantly associated with better overall survival (OS) in the BN2 genetic subset and worse OS in genetically unsubtyped cases. (C) In the EZB genetic subset, NK-cell infiltration was associated with significantly better OS, whereas FN1 expression in the tumor microenvironment and PD-1-high expression in T cells (cutoff, 55%) were associated with significantly poorer OS independent of MYC/BCL2 DhE status. (D) Higher CD4 T cell infiltration and CD8 T cell infiltration levels were associated with significantly better progression-free survival (PFS) within the BN2 and MCD genetic subset, respectively.

