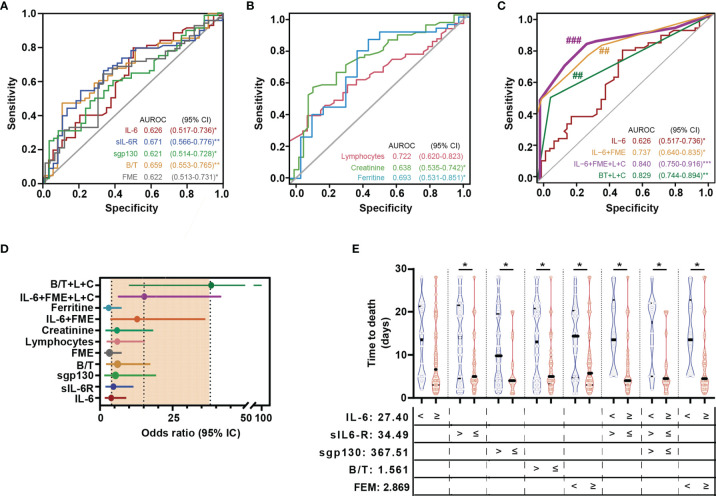
Figure 3.
IL-6 signalling biomarkers as predictors of mortality. AUROC curves (95% CI) of IL-6 signalling variables and biochemical data (A) and composed scores (B). Statistically significant differences among ROC curves were evaluated using DeLong’s test. ## p < 0.01 vs IL-6 ROC curve. (C) Forest plots of OR summarizing the risk of death for each variable or proposed score. (D) Violin plots indicating time to death according with levels of IL-6, sIL-6R, sgp130, Binary/Ternary complex ratio (B/T), and fold molar excess of sgp130 over sIL-6R (FME) above and below cut-off values. Each dot represents a sample; solid and dotted lines show the median and 95% CI, respectively. (L) lymphopenia and (C) creatinine. ***p < 0.001, *p < 0.05; **p < 0.01; ###p < 0.001 vs IL-6 ROC curve.

