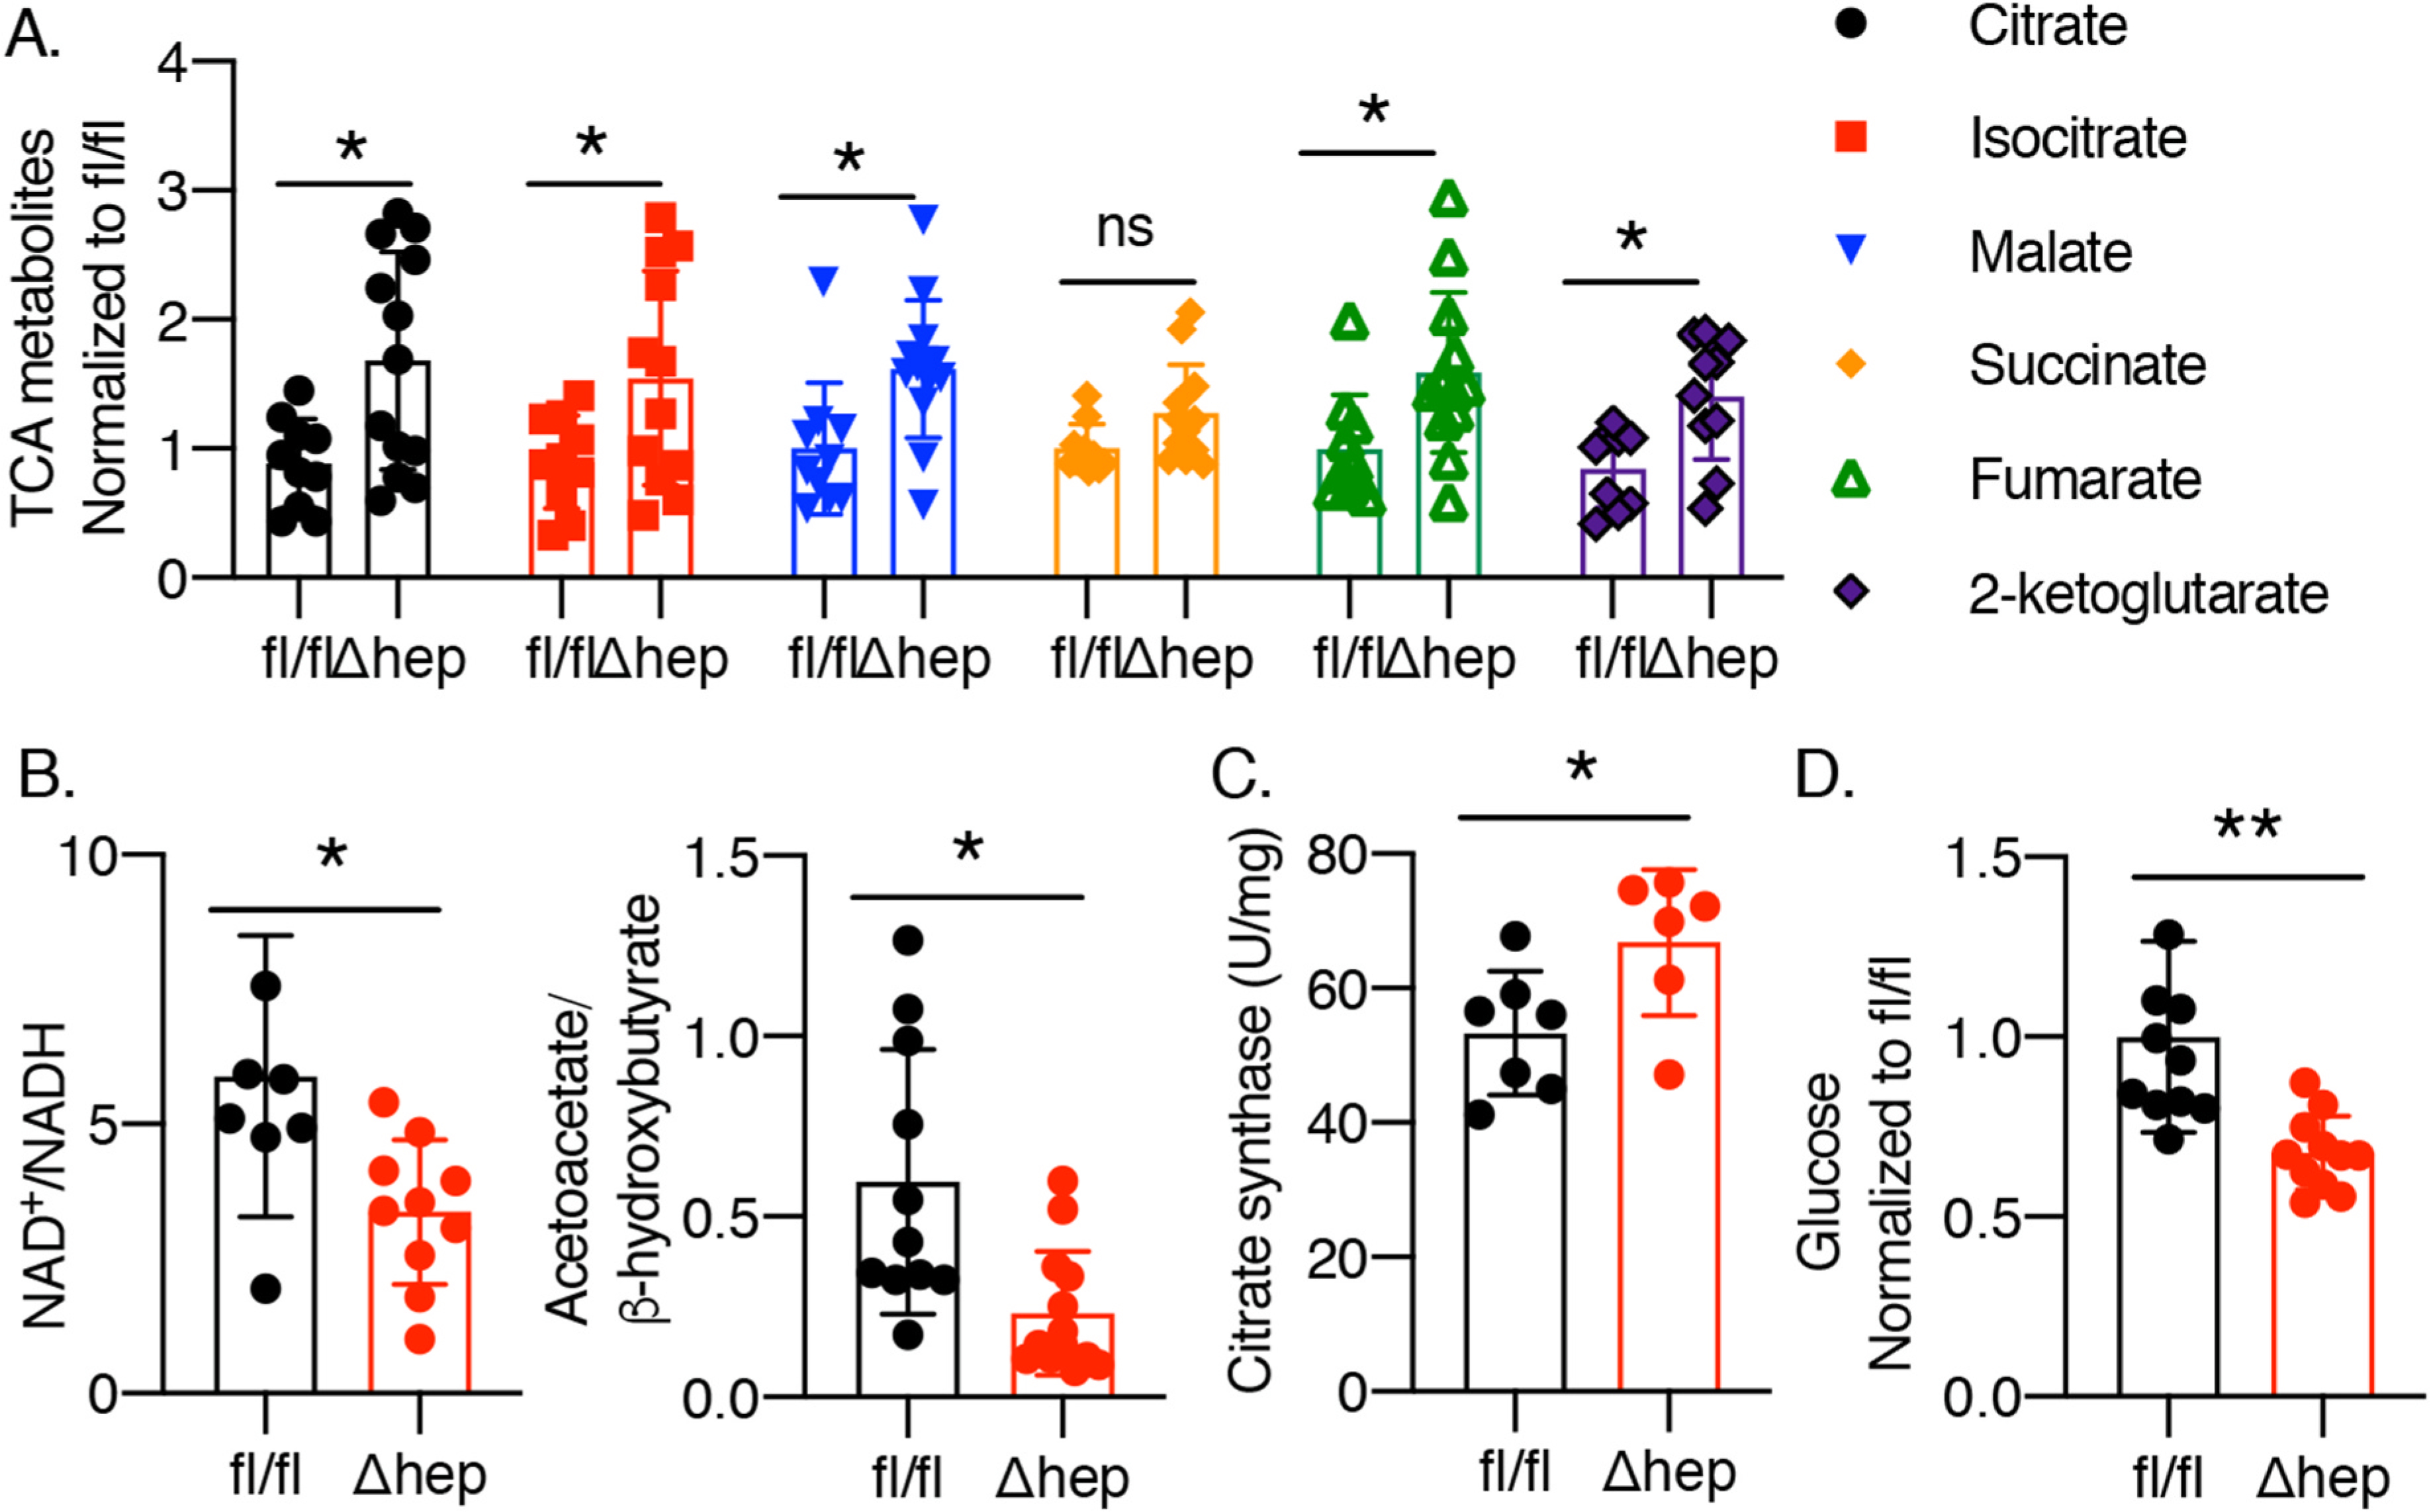
Fig. 3. Induction of TCA cycle in livers of PCBP1Δhep mice.

Metabolite analyses were performed on liver lysates of PCBP1fl/fl and PCBP1Δhep mice. A. Elevated TCA cycle intermediates in PCBP1Δhep livers. B. Reduction of liver NAD+/NADH and mitochondrial NAD+/NADH (acetoacetate/b-hydroxybutyrate) ratios in PCBP1Δhep livers. C. Elevated citrate synthase activity in PCBP1Δhep livers. D. Glucose depletion in PCBP1Δhep livers. Data represent mean ± SD. * indicates p < 0.05, **p < 0.01 as determined by 2-way ANOVA with Bonferroni multiple comparison test.
