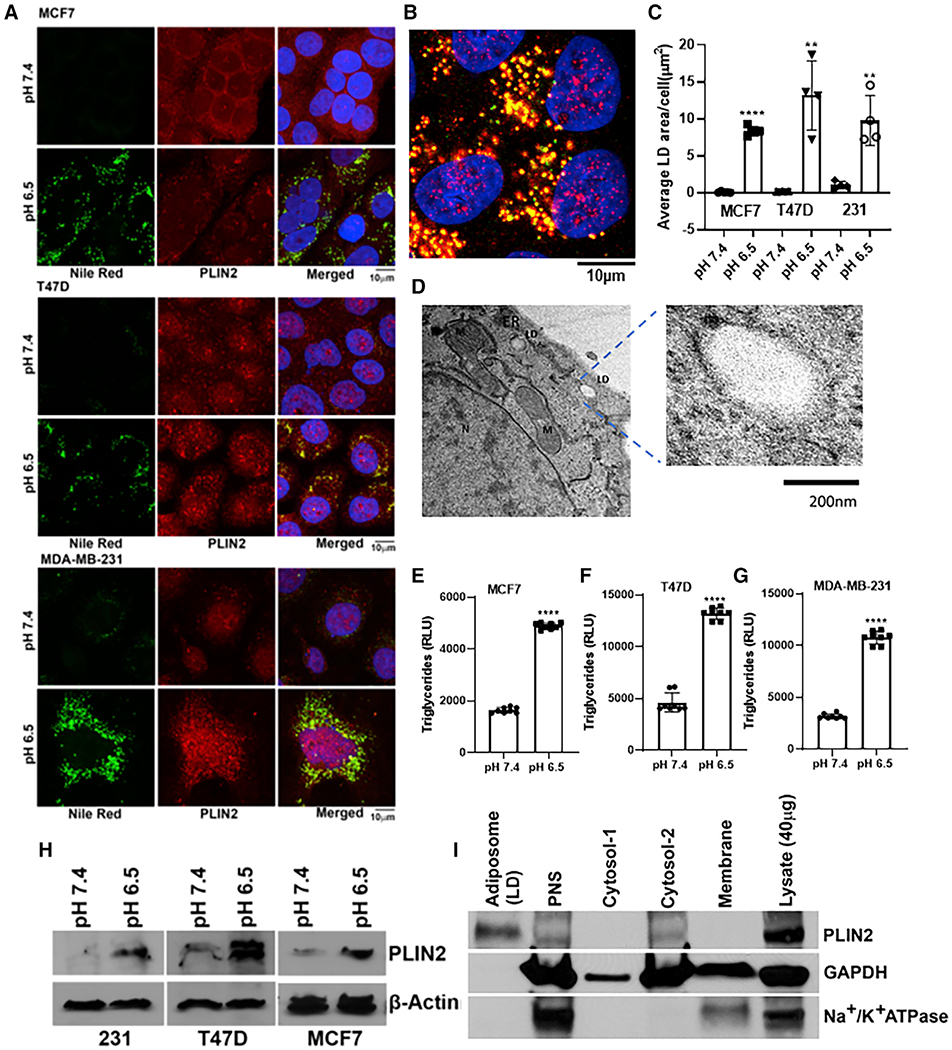
Figure 1. Induction of lipid phenotype by acidic pH.

(A) Confocal microscopy images of LDs induced by acidic pH (6.5) in breast cancer cell lines MDA-MB-231, MCF7, and T47D. Perilipin 2 (PLIN2, red), Nile Red (green), and DAPI (blue).
(B) High-magnification image of LDs induced by acidic pH in T47D cells.
(C) Quantification of LDs (green puncta) from MCF7, MDA-MB-231, and T47D. ****p = 0.0001, **p = 0.025, and *p = 0.029. Representative results from three independent experiments and three or more replicates per experiment.
(D) Transmission-electron-microscopy image from MCF7 cells grown in pH 6.5 media (N, nucleus; M, mitochondria; ER, endoplasmic reticulum).
(E–G) Triglyceride levels from MCF7, T47D, and MDA-MB-231 cells grown at pH 7.4 versus 6.5 media. Unpaired t test, p < 0.0001.
(H) Western blot analysis showing upregulation of PLIN2 in low-pH treated cells.
(I) Western blot showing the purity of LD-enriched fractions isolated from acid-treated MCF7.
