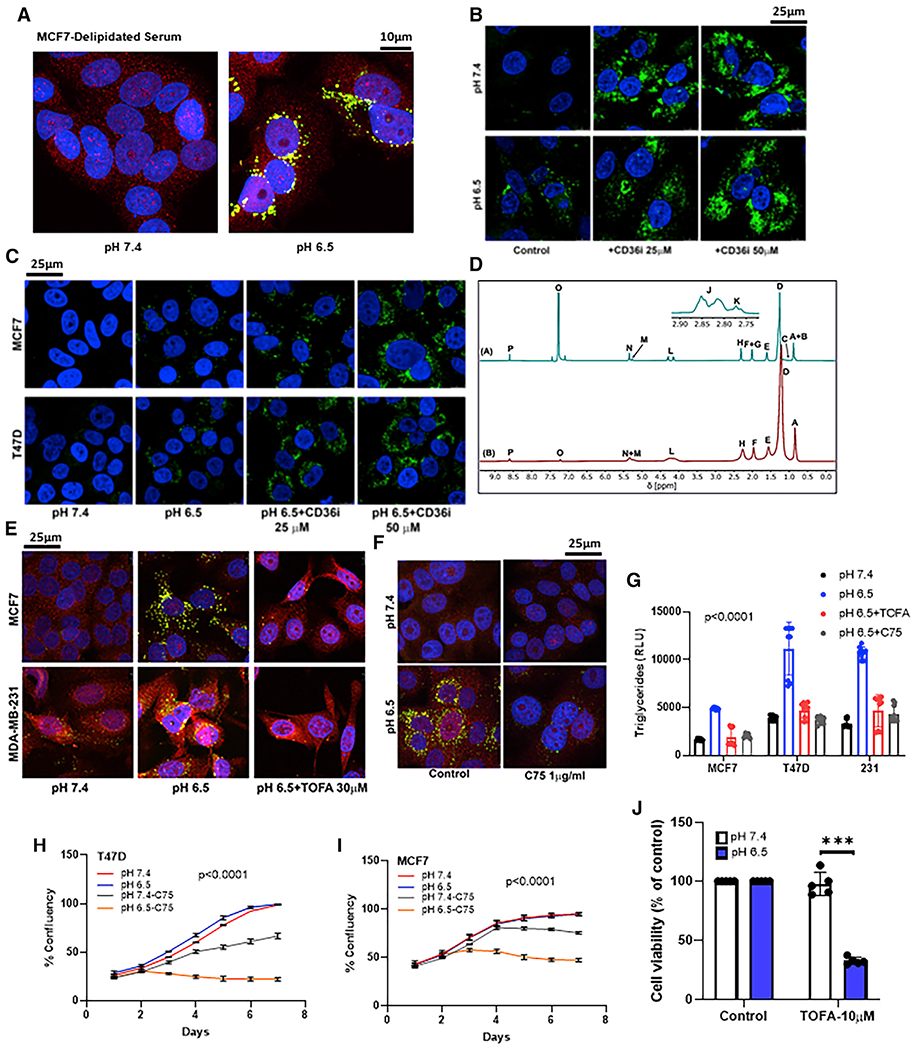
Figure 2. Acid-induced LD accumulation is associated with increased FA synthesis.

(A) LDs accumulate in cells when grown in delipidated serum under low pH. Confocal microscopy images of LDs induced by acidic pH (6.5) in MCF7 cells. PLIN2 (red), Nile Red (green), and DAPI (blue).
(B and C) CD36 inhibition using SSO (25 and 50 μM) did not abrogate LD accumulation in MDA-MB231, MCF7, and T47D cells.
(D) 1H [A] and 2H [B] NMR spectra of the LDs from T47D cells.
(A–P) Labeling on each spectrum represents (A) non ω-3 methyl; (B) partial ω-6 methyl; (C) ω-3 methyl; (D) aliphatic chain (methylene); (E) α3 aliphatic (-CH2-CH2-COO−); (F) monounsaturated allylic; (G) polyunsaturated allylic; (H) all α2 aliphatic (-CH2-CH2-COO−); (I) DHA α2 and α3; (J) other bis-allylic; (K) linoleic acid bis-allylic; (L) sn-1, sn-3 of esterified glycerol; (M) sn-2 of esterified glycerol; (N) olefinic; (O) chloroform; and (P) pyrazine standard.
(E and F) FA synthesis inhibition by TOFA (E) and C75 (F) significantly reduced LD formation at low pH. PLIN2 (red) and Nile Red (green).
(G) TG levels were significantly lower in C75- and TOFA-treated cells at low pH compared with cells treated with acidic media alone. p < 0.0001, one-way ANOVA.
(H and I) C75 (10 μg/mL) inhibited cell growth at low pH (6.5). Cell growth assessed by image-based live-cell analysis system (Incucyte). Two-way ANOVA, p < 0.0001.
(J) TOFA (10 μM) inhibited cell viability at low pH (MTT assay). t test, ***p = 0.00016, n = 5.
