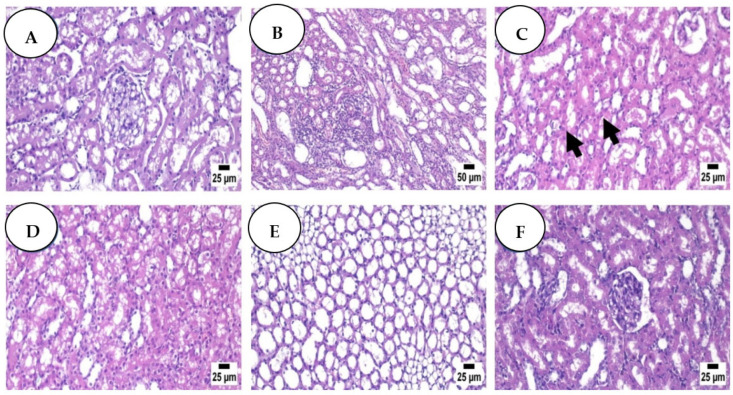
Figure 4.
Control group (A) high power view shows average glomeruli with average Bowman’s spaces, average proximal tubules with preserved brush borders (black arrow), average distal tubules, and average interstitium (H&E); Dox group (B) showing focal cystic dilation of renal tubules with focal interstitial nephritis (H&E); Dox + H group (C) showing apparently normal renal cortex with few tubules containing renal cast (arrow) (H&E); (D) (Dox + R), showing some degenerating renal tubules (H&E); Dox + P group (E) showing apparently normal renal medulla (H&E); Dox + H + R + P group (F) showing apparently normal renal cortex (H&E).

