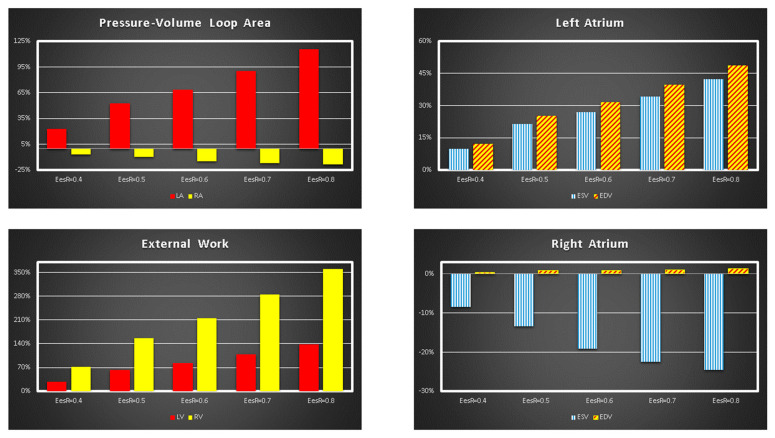
Figure 2.
Relative changes calculated in comparison to EesRIGHT = 0.3 mmHg/mL for different EesRIGHT values (0.4–0.8 mmHg/mL). The relative changes of the pressure–volume loop area of the left and right atrium (external work of the left and right ventricle) are reported in the left upper (lower) panel. The right upper (lower) panel shows the relative changes of left (right) atrial end systolic and end diastolic volume.

