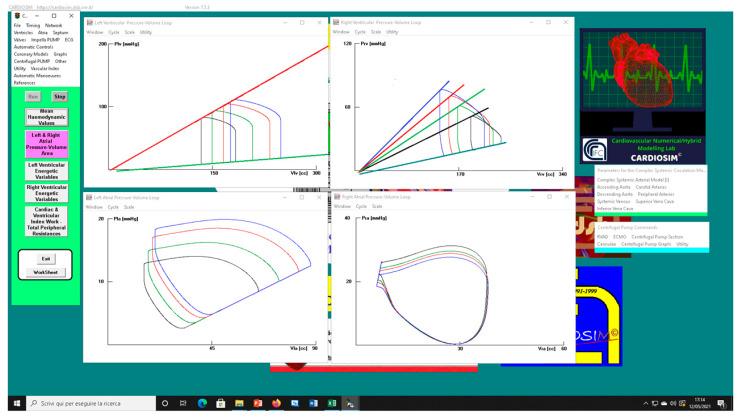
Figure 3.
Screen output from CARDIOSIM© software simulator. The left (right) upper panel shows four left (right) ventricular pressure–volume loops obtained by setting EesR ≡ EesRIGHT = 0.3 mmHg/mL (black line), EesR ≡ EesRIGHT = 0.4 mmHg/mL (green line), EesR ≡ EesRIGHT = 0.5 mmHg/mL (red line), and EesR ≡ EesRIGHT = 0.6 mmHg/mL (blue line), respectively. The left (right) lower panel shows four left (right) atrial pressure–volume loops obtained by changing the slope of the right ventricular elastance as previously described.

