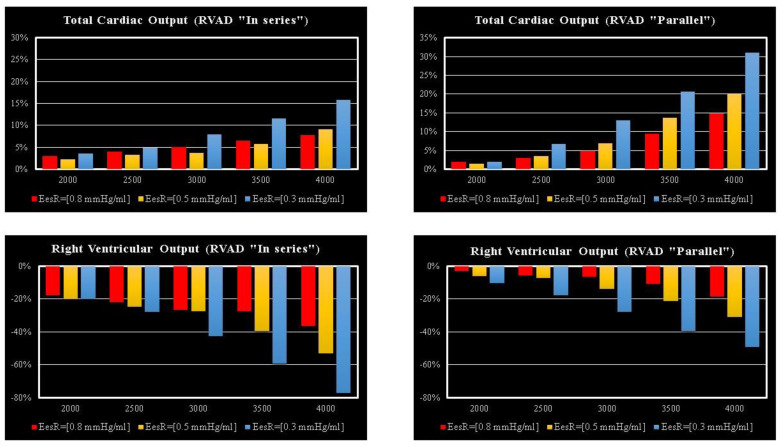
Figure 7.
Relative changes calculated in comparison to pathological conditions (EesR ≡ EesRIGHT = 0.3, 0.5, and 0.8 mmHg/mL) for different types of RVAD connection and different rotational speeds. For each value of EesRIGHT, the relative change was calculated when the RVAD was connected in parallel and in-series mode. The left (right) upper panel shows the relative changes in the total cardiac output (right ventricular flow output plus RVAD flow output) when the RVAD was connected in series (parallel) to the right ventricle. The left (right) lower panel shows the relative changes in the right ventricular flow output when the RVAD was connected in series (parallel) to the right ventricle.

