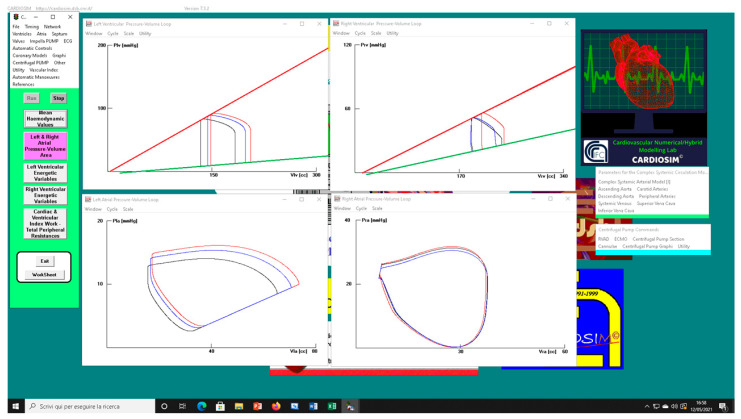
Figure 8.
Screen output generated by CARDIOSIM© platform. The left (right) upper panel shows the left (right) ventricular pressure–volume loops when pathological conditions (EesRIGHT = 0.3 mmHg/mL) (black line), in-parallel RVAD (pump rotational speed at 3000 rpm) (red line), and in-series RVAD assistance (pump rotational speed at 3000 rpm) (blue line) were reproduced by the simulator, respectively. The left (right) lower panel shows the left (right) atrial pressure–volume loops reproduced by CARDIOSIM©.

