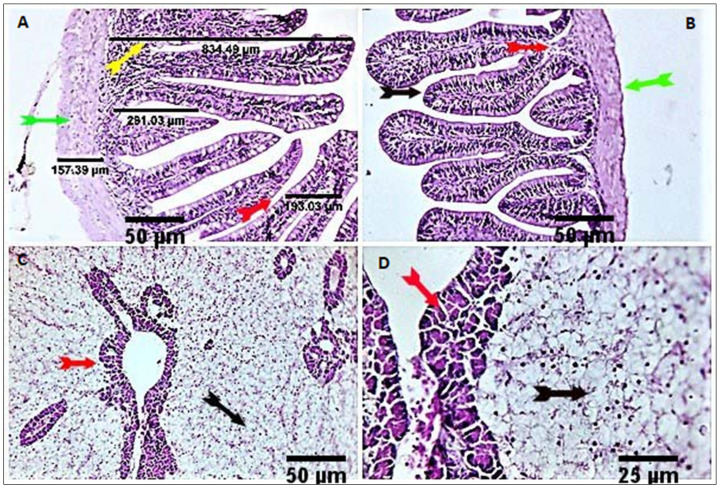
Figure 2.
Stained sections of the anterior and posterior intestines of the control group showed normal histological structure (A,B) with variable numbers of goblet cells (yellow and red arrows). The liver of the control group showed normal histomorphological structures with normal features of hepatopancreatic structures (red arrows) and hepatic cord orientation (black arrows) (C,D). Scale bars = 25 µm, 50 µm.

