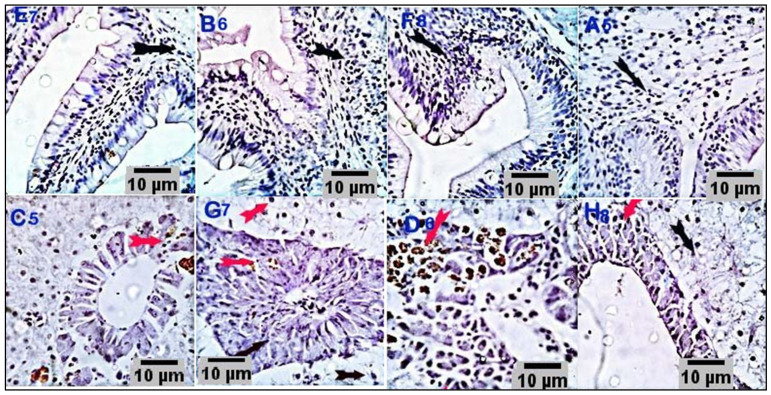
Figure 7.
Stained sections of the intestine (E7, B6, F8, and A6) and liver (C5, G7, D6, and H8) of the respective treatment groups (CUR200, CUR400, CUR600, and CUR800, respectively) immunostained against TNF-α. Sections from intestines of different treatment groups (E7, B6, F8, and A6) immunostained against TNF-α, showing a weak positive reaction in a few mucosal and submucosal mononuclear cells (2.5%, 3.5%, 4%, and 14% of cells in CUR200, CUR400, CUR600, and CUR800 groups, respectively). Liver sections (C5, G7, D6, and H8) also demonstrated weak reactivities in a variable number of hepatic and hepatic portal cells (3.9%, 10%, 25%, and 25% of cells in CUR200, CUR400, CUR600, and CUR800 groups, respectively). Scale bars = 10 µm.

