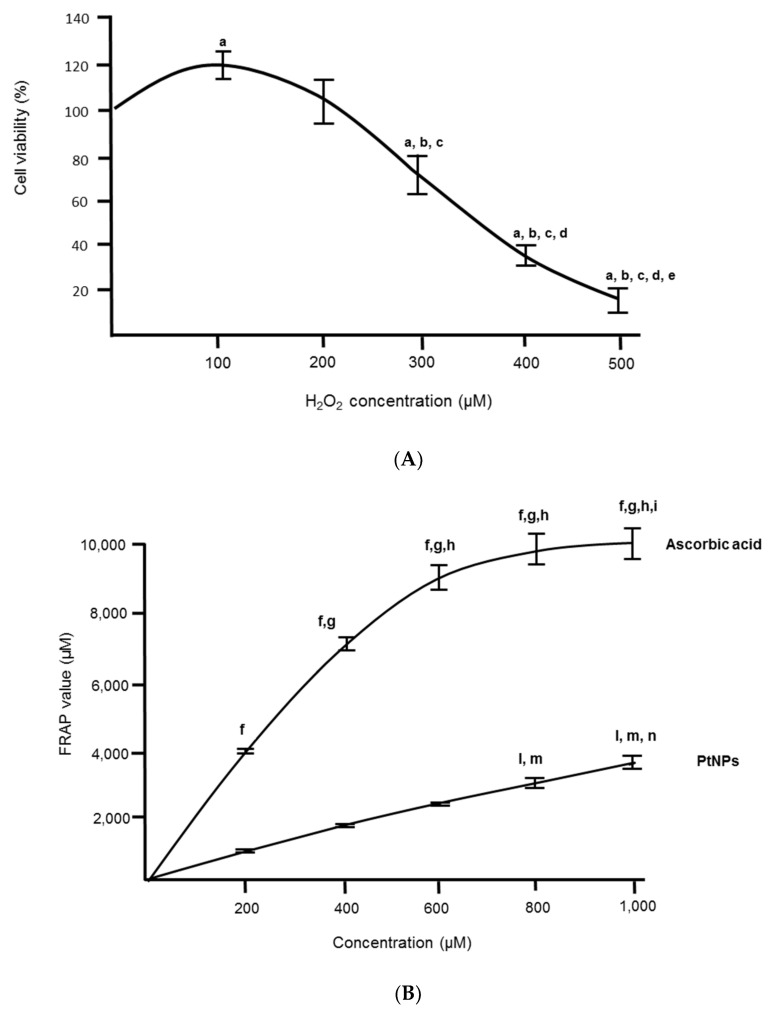
Figure 1.
(A) Cell viability percentage of H2O2 concentration (n = 3). A statistically significant difference (p < 0.05) denoted in alphabet a–e represents a comparison between a group to, a: untreated H2O2 (0 µM), b: 100 µM, c: 200 µM, d: 300 µM, and e: 400 µM. (B) antioxidant capacity of PtNPs and ascorbic acid using FRAP assay (n = 3). A statistically significant difference (p < 0.05) denoted in alphabet f–i (ascorbic acid) and l–n(PtNPs) that represents a comparison between a group to, f and l: untreated cells (0 µg/mL), g and m: 200 µg/mL, h and n: 400 µg/mL, i: 600 µg/mL.

