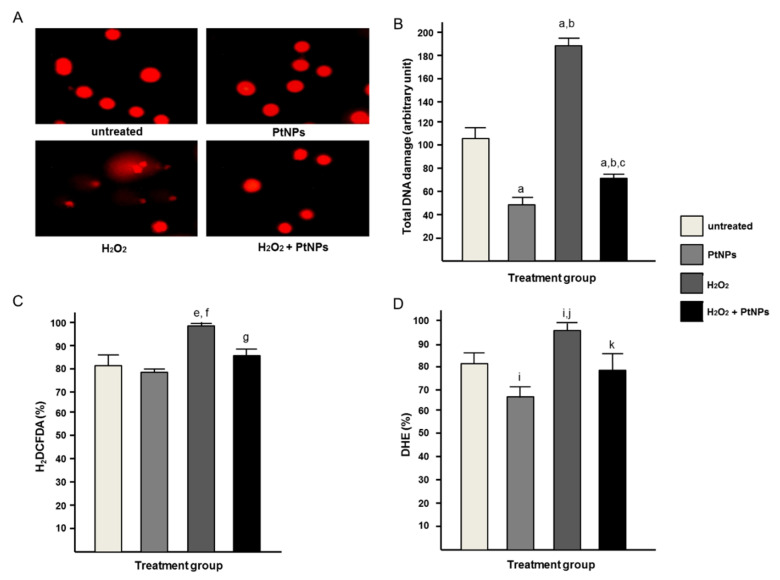
Figure 5.
(A) Oxidative status through DNA damage represented with comet assay qualitatively. Comet tail can be seen in DNA damaged cells and quantitatively measured in (B) total DNA damage and ROS production represented (C) H2DCFDA and (D) DHE, respectively. A statistically significant difference (p < 0.05) denotes in alphabet a–c (A), e–g(B), i–k (C) that represents a comparison between a group to a/e/i: untreated cells, b/f/j: PtNPs, and c/g/k: H2O2.

