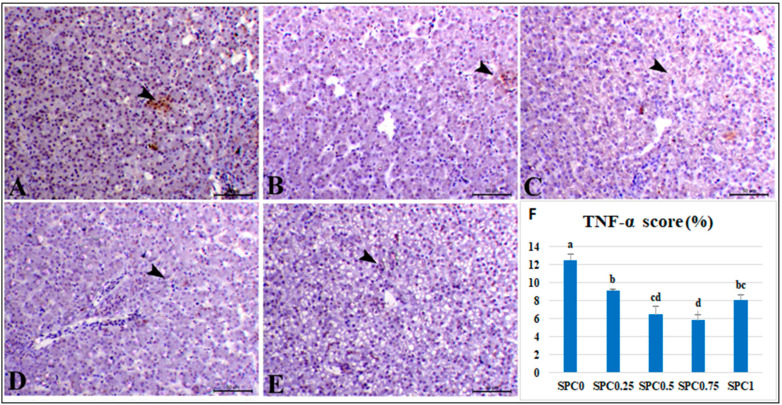
Figure 4.
Photomicrograph of hepatic tissues immunostained with TNF-α antibody. The liver of the control SPC0 group showed mild expression of TNF-α within a few hepatocytes (A) (arrowhead). The liver of the SPC0.25 group showed scanty expression of TNF-α within hepatocytes (B) (arrowheads). The liver of the SPC0.5 group showed a marked decrease in immunostaining of TNF-α within hepatic tissues (C) (arrowhead). The liver of the SPC0.75 showed a significant decrease in the expression of TNF-α within the blood sinusoids (D) (arrowhead). The liver of SPC1 showed a marked decrease in the expression of TNF-α within hepatocytes (E) (arrowhead). Bar = 50 µm. (F) shows morphometric measures of TNF-α immunostaining expression (%). a,b,c,d Means carrying different superscripts were significantly different (p ≤ 0.05).

