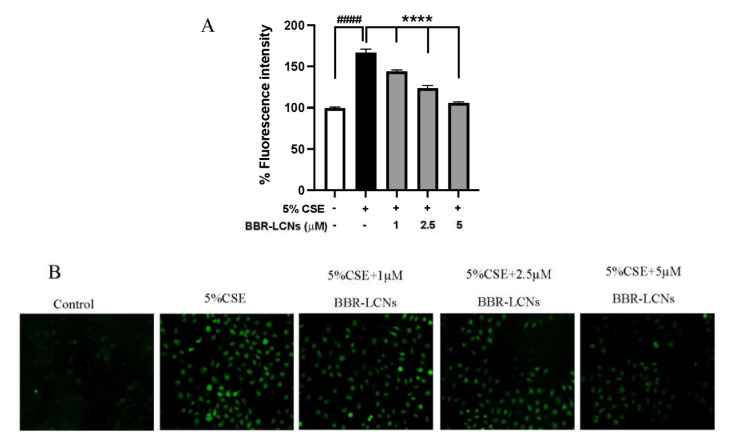
Figure 2.
Effect of BBR-LCNs on ROS production in 16HBE cells. (A) Measurement of fluorescence intensity. The fluorescence intensity was measured at an excitation 485 nm and an emission 535 nm; n = 3 independent experiments and each independent experiment contained 6 replicates. #### p < 0.0001 vs. control (without BBR-LCNs and 5% CSE treatment) and **** p < 0.0001 vs. 5% CSE. Values are expressed as mean ± SEM. Analysis was carried out using one-way ANOVA followed by Dunnett’s multiple comparison test. (B) Fluorescence imaging. The DCF-DA fluorescence staining images of 16HBE cells treated with 5% CSE and with/without different concentrations of BBR-LCNs were taken with Zeiss Axio Imager Z2 microscope at 20× magnification. CSE: Cigarette smoke extract; BBR-LCN: Berberine-liquid crystalline nanoparticles.

