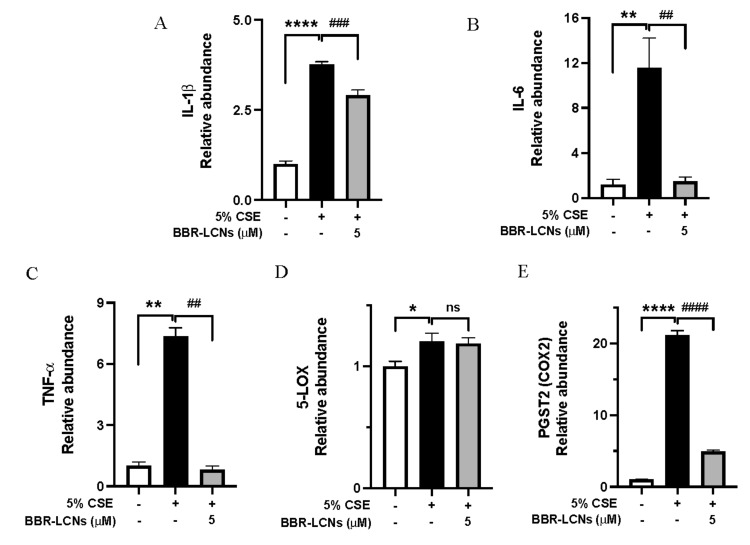
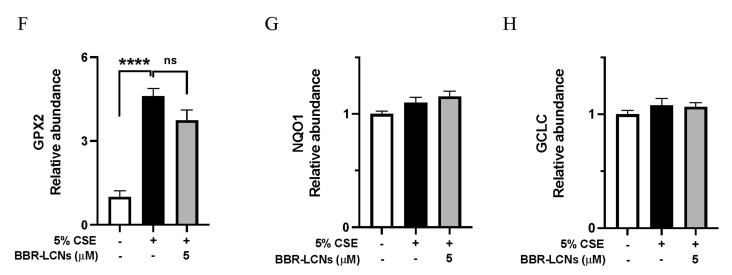
Figure 4.
Expression of inflammation-related genes (A) IL-1b, (B) IL-6, (C) TNF-a, (D) 5-LOX, (E) PSGT2, and oxidative-stress-related gene (F) GPX2, (G) NQO1, and (H) GCLC expression upon treatment with BBR-LCNs on 16HBE cells. Values are expressed as mean ± SEM (n = 4–6); * p < 0.05 ** p < 0.01, **** p < 0.0001 (control vs. 5%CSE) and ## p < 0.01, ### p < 0.001 #### p < 0.0001 (5% CSE vs. 5% CSE + BBR-monoolein). ns = not significant. Analysis was performed by a one-way ANOVA followed by Tukey multiple comparison test.


