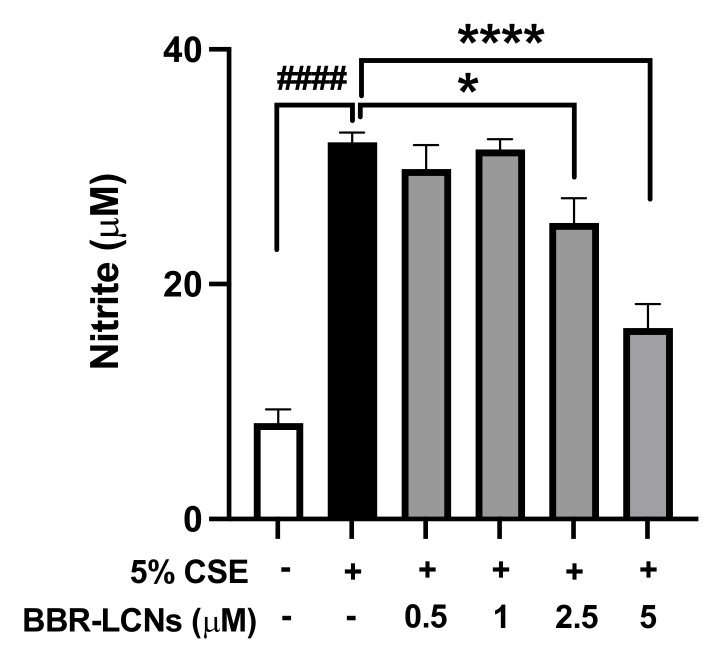
Figure 6.
Effect of BBR-LCNs on NO production in RAW264.7 cells. NO production (in terms of nitrite) was quantified with Griess’ reagent by measuring absorbance at 540 nm. ####p < 0.0001 vs. control (without BBR-LCNs and 5% CSE treatment) and * p < 0.05; **** p < 0.0001 vs. 5% CSE. Values are expressed as mean ± SEM, n = 3 independent experiments. Analysis was performed with one-way ANOVA followed by Dunnett’s multiple comparison test.

