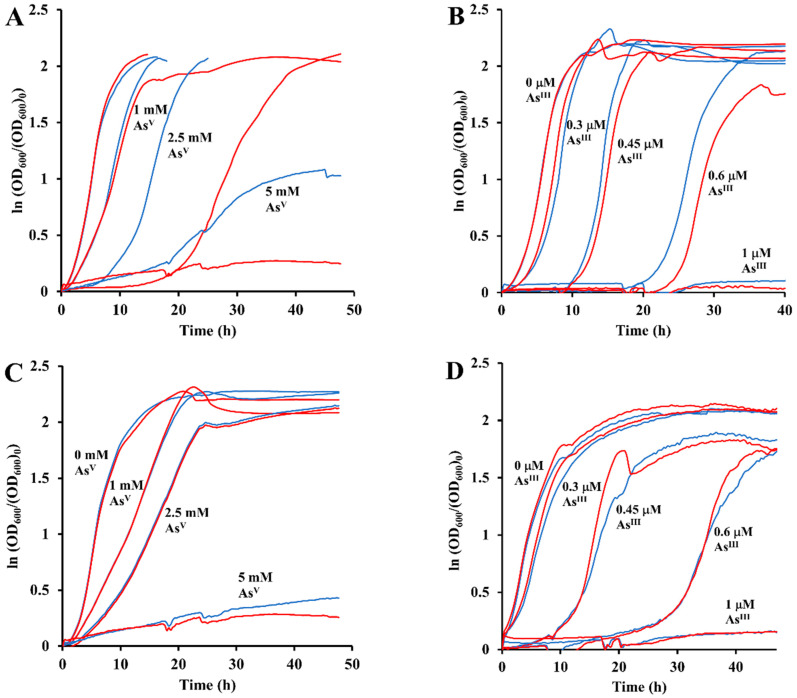
Figure 7.
The averaged (n = 3) growth curves of E. coli BL21(DE3)pLys harboring the arsH gene (panels (A,B)) and the negative control lacking it (panels (C,D)) cultured in M9 medium with glucose with the addition of the indicated concentration of PhAsO(OH)2 (panels (A,C)) or PhAsO (panels (B,D)). Blue curves and red curves have been obtained in the absence and in the presence of 1 mM IPTG, respectively.

