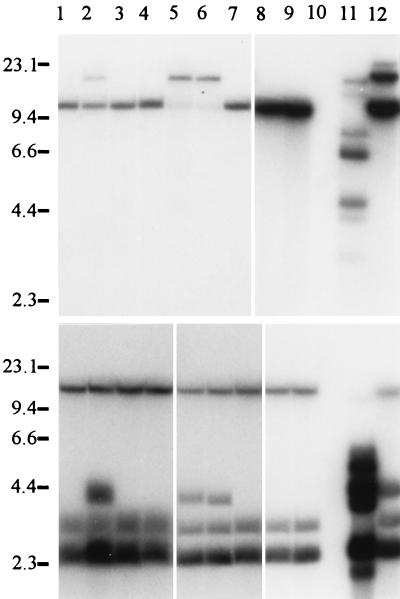
FIG. 2.
Integration pattern of the transformation vector obtained by Southern blot analysis. Genomic DNAs of the wild type and the gib− mutants were digested with HindIII (upper part of the figure; one restriction site in pAN7-1) and EcoRI (lower part of the figure; two restriction sites in pAN7-1). The blot was probed with linearized pAN7-1. Lanes: 1, gib11; 2, gib10; 3, gib9; 4, gib8; 5, gib7; 6, gib6; 7, gib5; 8, gib4; 9, gib3; 10, wild type; 11, gib2; 12, gib. The heavy band at 6.8 kb in lane 11 in the upper part marks the vector size. The heavy band at 2.5 kb in all lanes of the lower part of the figure corresponds to an internal EcoRI fragment of the vector. Sizes are indicated on the left in kilobases.

