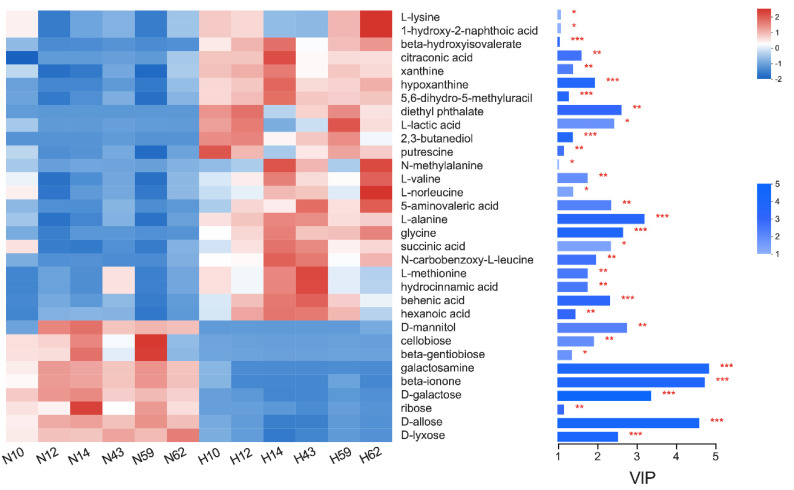
Figure 3.
Differential metabolites in rumen fluid of buffalo under non-heat stress and heat stress conditions. The heatmap is the metabolite expression and the right side is the metabolite variable importance in projection (VIP) bar graph. The color of the bar indicates the significance of the difference between the two groups of metabolites, * represents p < 0.05, ** represents p < 0.01, *** represents p < 0.001. N, non-heat stress condition; H, heat stress condition.

