Figure 17.
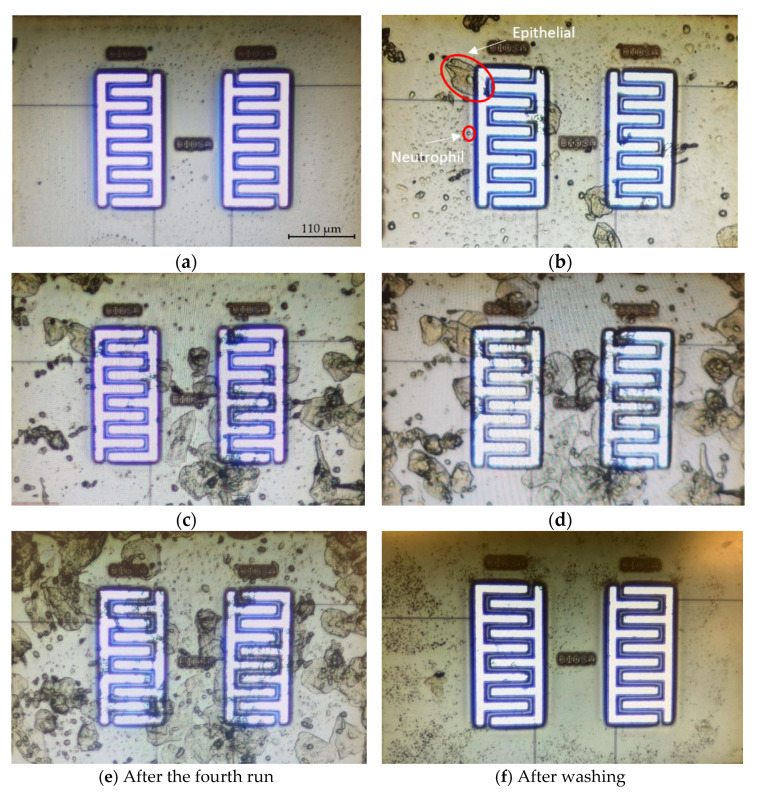
The microscopic image of the surface of the chip for the first experiment: (a) before putting samples; (b) after the first sample; (c) after the second sample; (d) after the third sample; (e) after the fourth sample; (f) after washing (the size of the electrodes is 220 µm × 110 µm, which shows the scale of the images).

