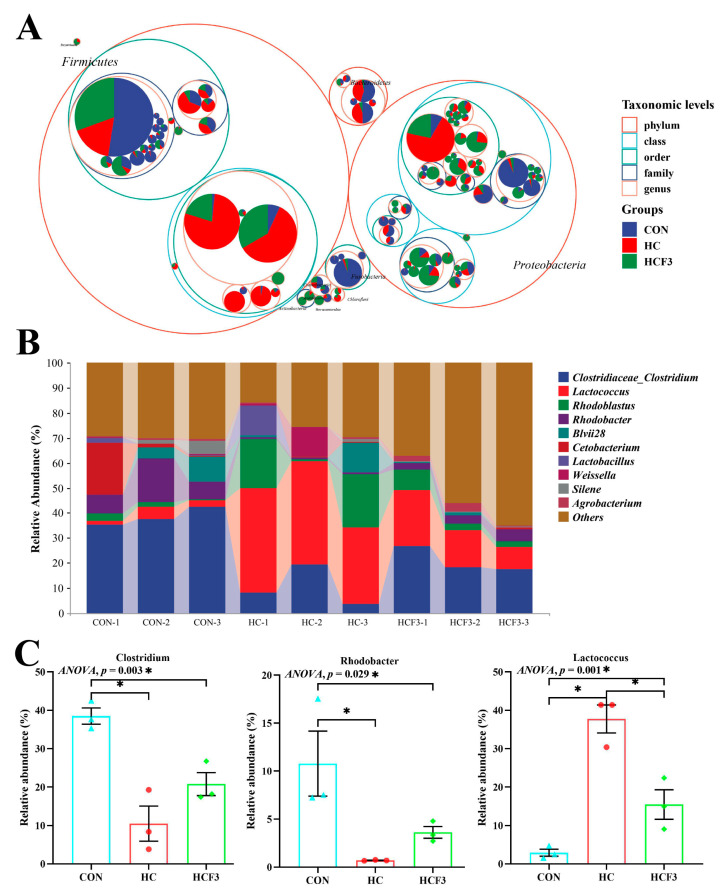
Figure 8.
Effects of dietary mulberry leaf flavonoids on the intestinal microbial composition of rice field eel (Monopterus albus) fed high-carbohydrate diets. (A) Classification hierarchy tree diagram (The largest circle represents phylum level, and the decreasing circle represents class, order, family, genus and species in descending order). (B) Species abundance at the genus level (Top 10), (C) showing significant variations of the relative abundance of intestinal microbiota at the genus level. * indicates a significant difference between groups (p < 0.05).

