Figure 4.
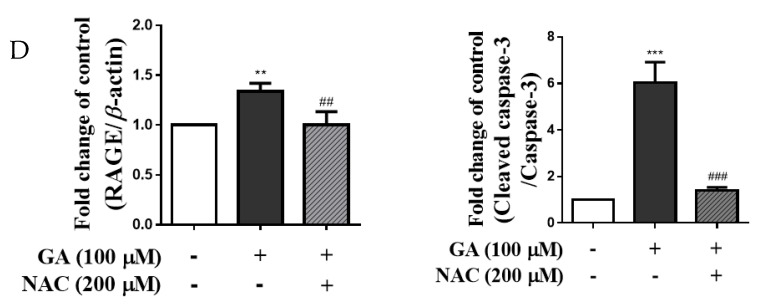
Changes in expression of RAGE apoptosis-related protein in mesangial cells by GA-induced oxidative stress. Mesangial cells were treated with sole GA (100 µM), or GA (100 μM) followed by cotreatment with AG (1 mM) or NAC (200 μM) for 24 h. (A) Intracellular ROS production was evaluated using DCFH-DA dye, and cells were detected by fluorescence (scale bar = 50 μm). (B) Quantification of intracellular ROS generation in mesangial cells. The control groups were analyzed using ImageJ software, and all data were normalized to control cells. (C) Protein expression of RAGE and caspase-3 was detected by Western blotting. (D) Quantification of RAGE and caspase-3 expression levels. β-actin was used as an internal control. Data were obtained from three independent experiments. Values are presented as the mean ± SD from three independent experiments. ** p < 0.01 and *** p < 0.001 vs. untreated group, ## p < 0.01 and ### p < 0.001 vs. 100 μM GA. GA, glycolaldehyde; NAC, N-acetyl-l-cysteine; RAGE, receptor for advanced glycation end products.


