Figure 5.
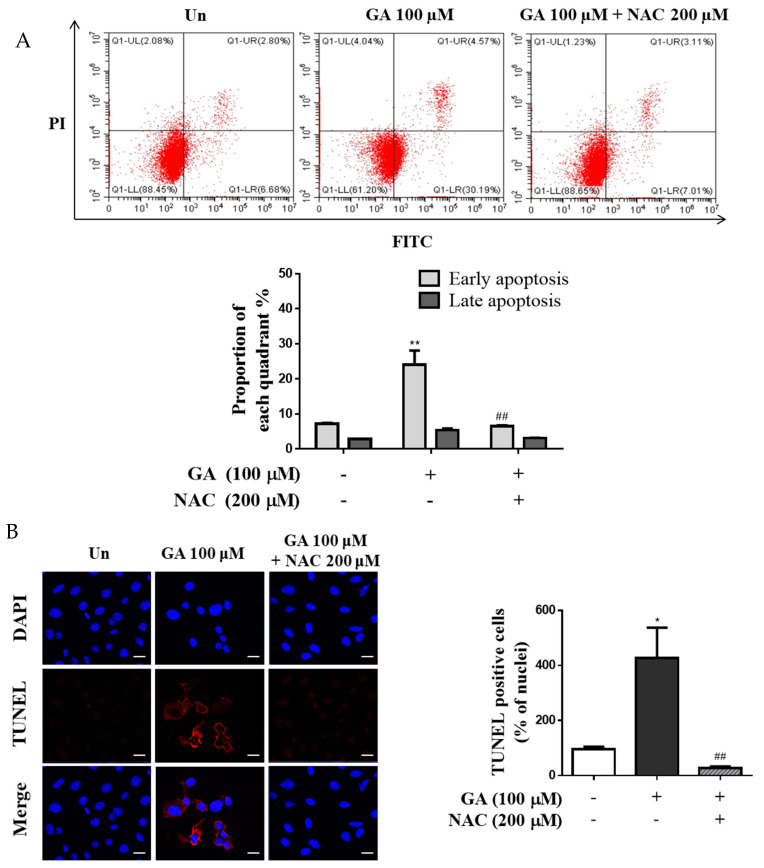
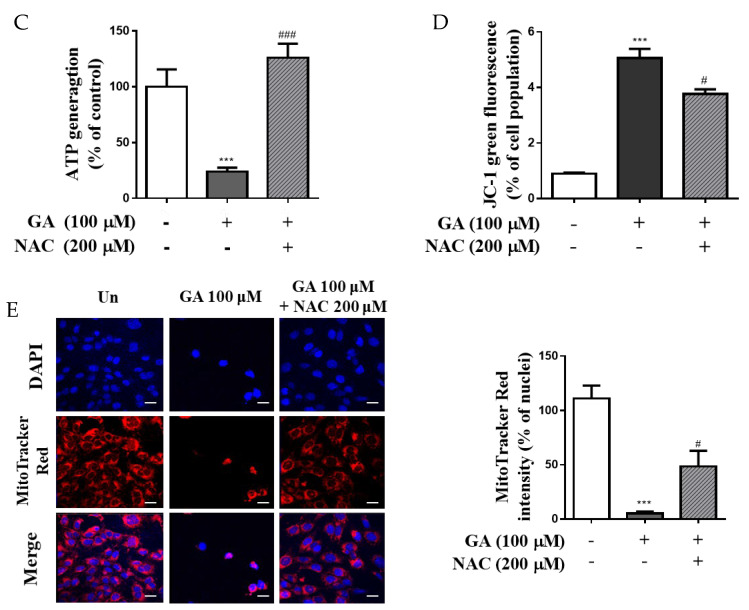
GA-stimulated apoptosis through the oxidative stress via mitochondrial dysfunction in mesangial cells. Cells were incubated with GA (100 µM) and GA cotreated with NAC (200 μM) for 24 h. (A) The rate of apoptosis induced by GA in mesangial cells and the rate of apoptotic cells are presented as percentage of apoptotic cells per total cell number. (B) TUNEL staining images are shown, where red fluorescence indicates DNA fragmentation. Apoptosis was stimulated by GA and prevented by ROS induction via NAC cotreatment (DAPI blue = nuclei) (scale bar = 10 μm). The bar graph shows the percentage of TUNEL-positive nuclei relative to the control, measured using ImageJ software. (C) The levels of ATP production were measured using a bioluminescence ATP detection assay kit. (D) MMP was determined using JC-1 dye by flow cytometry. (E) Images were visualized by confocal microscopy through double-staining with MitoTracker Red and DAPI. Red and blue fluorescence represent MitoTracker Red-stained mitochondria and nucleus, respectively (scale bar = 10 μm). The graph shows the percentage of fluorescence intensity relative to the control, measured using ImageJ software. Data are expressed as mean ± SD. Independent experiments were performed at least thrice. * p < 0.05, ** p < 0.01, and *** p < 0.001 vs. untreated group, and # p < 0.05, ## p < 0.01, and ### p < 0.001 vs. 100 μM GA. GA, glycolaldehyde; NAC, N-acetyl-l-cysteine.


