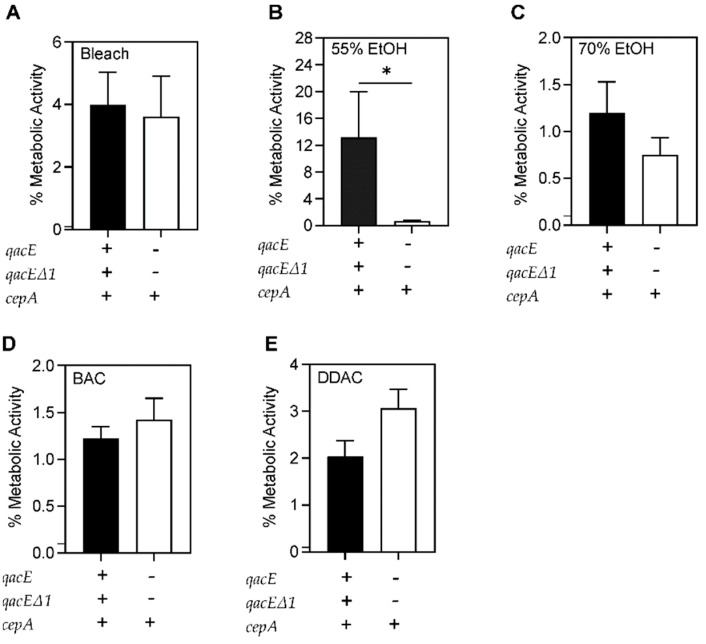
Figure 7.
Comparison of survival of bacterial biofilms formed by microbicide-resistant and -susceptible strains. Average percentage of metabolic activity of four microbicide-resistant and six microbicide-sensitive strains. No significant differences were seen between resistant and sensitive strains after (A) 4 min of bleach exposure. (B) Significantly more microbicide-resistant bacteria survived compared to sensitive strains after 1 min of 55% ethanol exposure (p = 0.04). No significant differences between resistant and sensitive bacteria were seen after (C) 1 min of 70% ethanol, (D) 2 min of 0.5% BAC, and (E) 1 min of 0.61% DDAC exposure. The average metabolic activity of is displayed and error bars represent the standard deviation. A p-value of ≤0.05 was considered significant. * p-value < 0.05.

