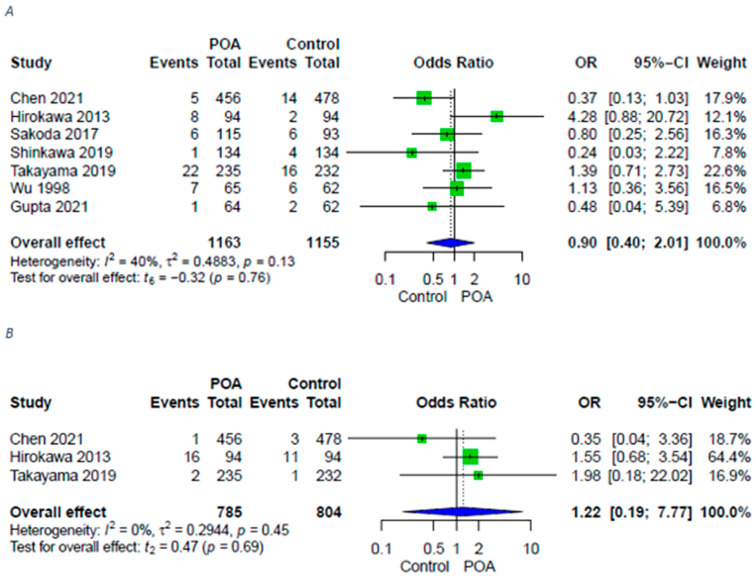
Figure 3.
Forest plots for remote infections in patients with POA versus control. (A) Forest plot for remote infections in patients with POA versus control; (B) Forest plot for sepsis in patients with POA versus control. A random-effects model was utilized for all outcomes due to heterogenic methodological and clinical framework of included studies. Statistical heterogeneity was evaluated using the I2 statistics. An I2 value below 25% indicated low heterogeneity, while over 75% was considered high.

