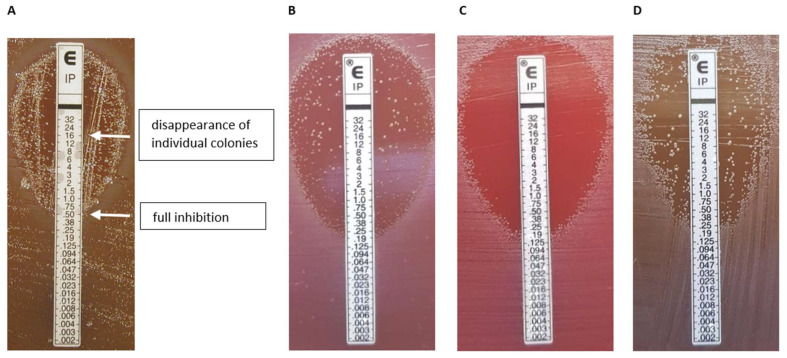
Figure 2.
Etest HR phenotypes. A typical Etest phenotype (B. fragilis 16997) [8] showing the reading annotation; in this example 0.5–(16), the first value expresses the inhibition of full growth, then after a dash, the value indicates in parenthesis where the inside colonies disappeared. (A). The ‘inheritance’ of the Etest HR phenotype (B–D). Original appearance (B); an inner colony direct Etest (C); an Etest result of an inner colony after an intermediate cultivation on a Columbia blood agar (D).

