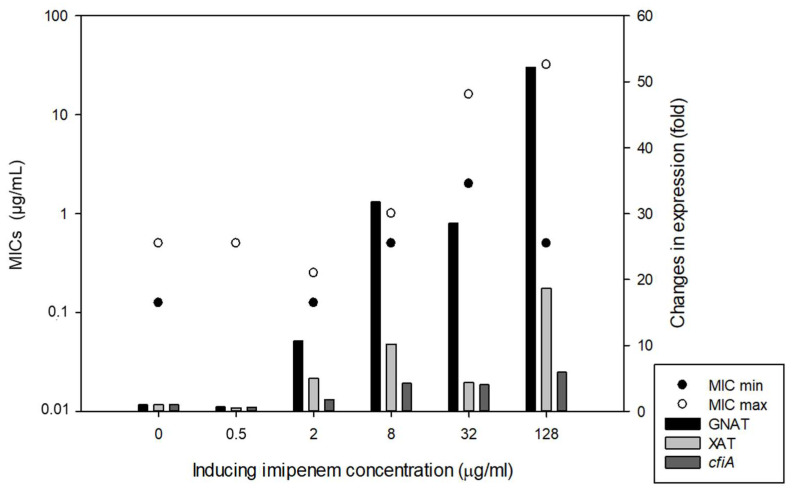
Figure 5.
Induction of HR in B. fragilis 3130 with increasing imipenem concentration in the culture media (BHIS). The left-hand y-axis denotes the Etest AST values (full and partial inhibition marked as minimal and maximal MICs) and right-hand y-axis shows the gene expression changes for the strains in the induction experiments, respectively.

