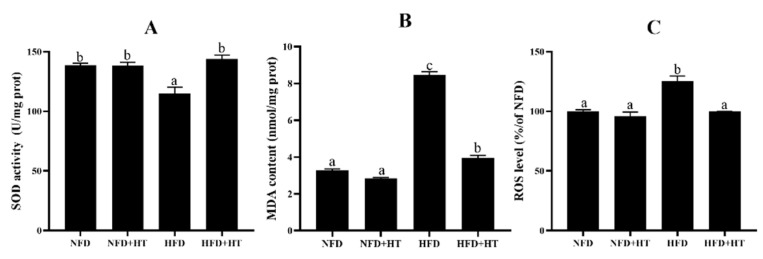
Figure 3.
Superoxide dismutase activity (SOD: (A)), malondialdehyde content (MDA: (B)) and reactive oxygen species content (ROS: (C)) in the liver of L. maculatus fed the test diets for 8 weeks. All values are exhibited as mean ± SE. The values with different superscripts (a, b, c) are significantly different at p < 0.05 (Tukey’s test).

