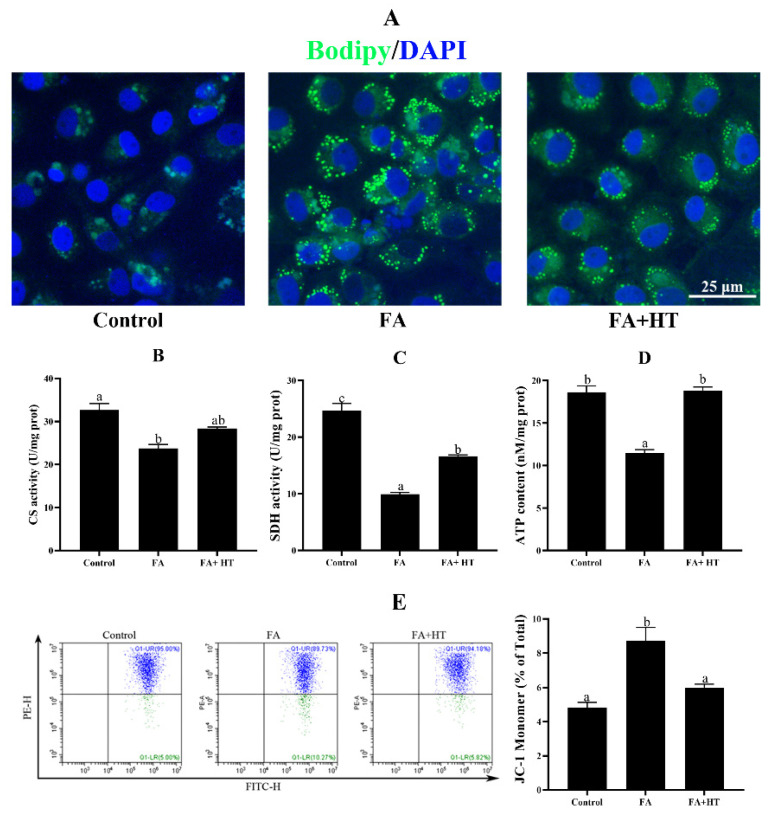
Figure 6.
Staining of fat droplet by BODIPY 493/503 (green) in ZFL cell (A). Nuclei are highlighted with Hoechst 33342 (blue), scale bar = 25 μm. Citrate synthase (CS: (B)) and succinate dehydrogenase (SDH: (C)) activities and ATP content (ATP: (D)) in ZFL cell. Mitochondrial membrane potential (MMP) of ZFL cell was detected by the flow cytometer assessment of JC-1 staining (E). The ratio of JC-1 monomer is shown. Control group—complete LDF medium; FA group—FA medium (complete LDF medium with 0.25 mM oleic acid and 0.25 mM palmitic acid); FA + HT group—FA medium containing 50 μM of HT. All values are exhibited as mean ± SE. The values with different superscripts (a, b, c) are significantly different at p < 0.05 (Tukey’s test).

