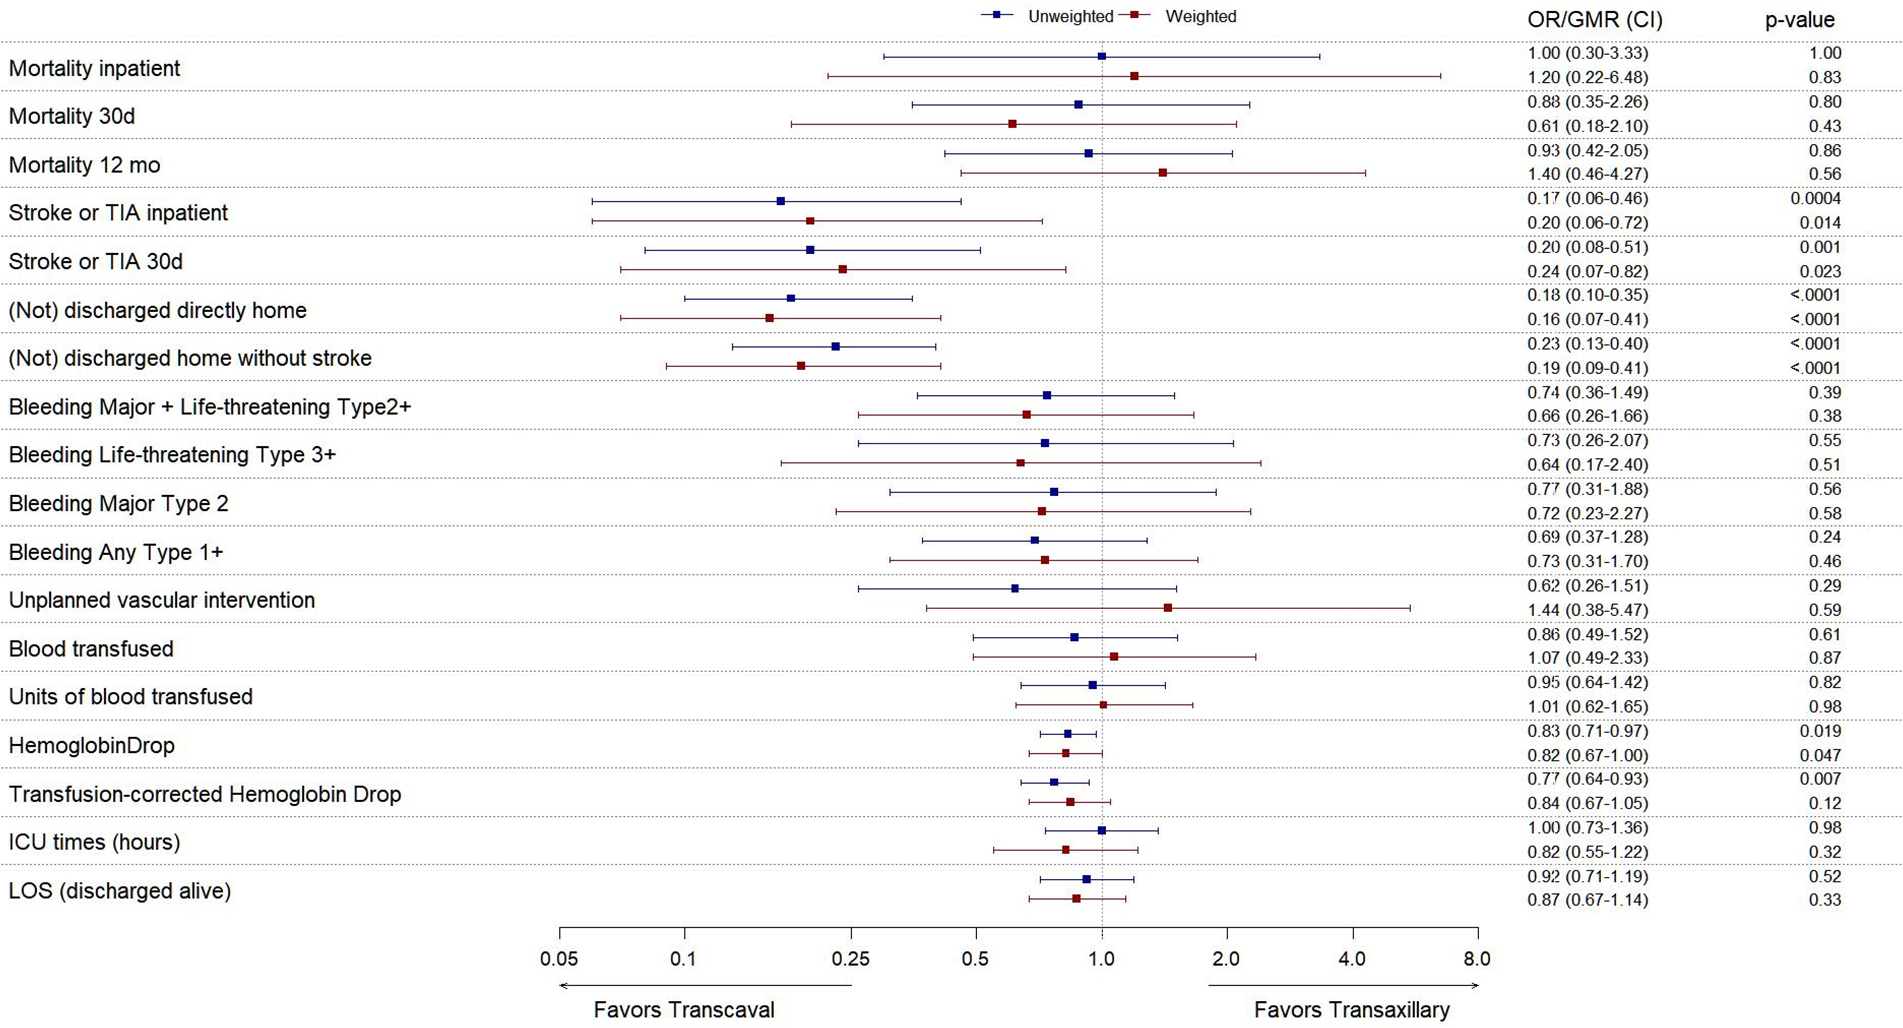
Figure 1.

Outcomes before- and after adjustment for baseline imbalances.
Forest plot of relative outcomes of transcaval versus transaxillary access, expressed as OR (Odds Ratio) for parametric data and as GMR (Geometric Mean Ratio) for continuous data, with 95% CI (confidence intervals). Values with confidence intervals that do not cross OR/GMR=1.0 are considered statistically significant. Plots show unweighted (blue) and inverse propensity-score-weighted (red) outcomes. ICU = Intensive Care Unit; LOS = Length of Stay; Corrected hemoglobin drop = (baseline – discharge hemoglobin) + (units of PRBC transfused).
