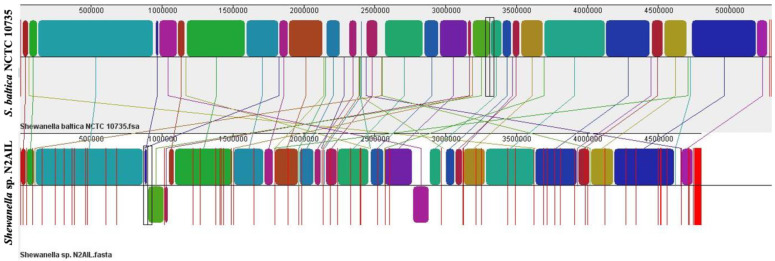
Figure 5.
Genome alignment of Shewanella sp. N2AIL and S. baltica NCTC 10735 performed using MAUVE showed variation in genome structure. The scale shown above represents coordinates of each genome. LCB’s (Local Collinear Blocks) shown in different colours represented conserved segments in both the genomes. White area present within the LCB’s represents the regions with low similarity. LCBs shown above the central black horizontal line are in forward orientation and below are in reverse orientation. Coloured lines show rearrangements between two genomes.

