Figure 4.
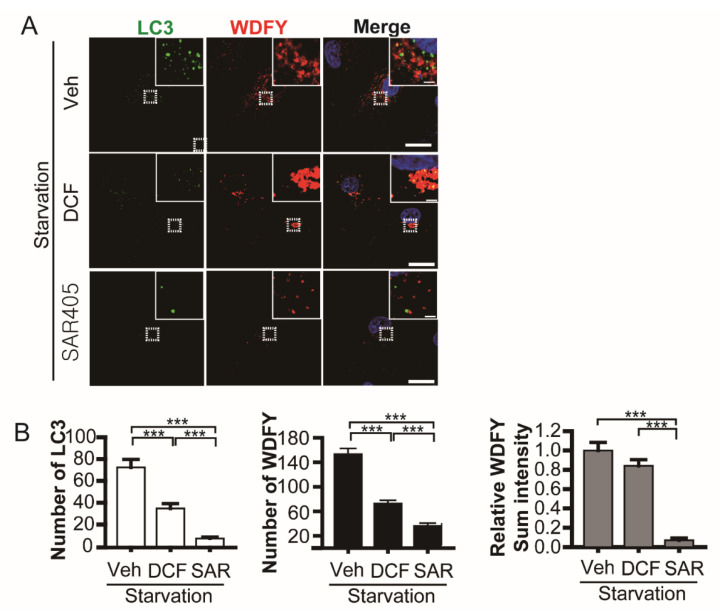
Diclofenac inhibits phagophore movement followed by autophagosome formation. (A) Nutrient-starved (Earle’s balanced salt solution) HepG2 cells expressing GFP-LC3 and mCherry-WDFY (PtdIns(3)P reporter) were incubated in a medium containing vehicle (0.1% dimethyl sulfoxide), diclofenac (500 µM), or SAR405 (500 nM) for 8 h. Nuclei were stained with 4–6-diamidino-2-phenylindole. Images were obtained from confocal microscopy. Scale bars, 20 µm; scale bar in insets, 2 µm. (B) Quantification of images from (A). The number of LC3 spots (left) and WDFY spots (middle) per cell. Relative sum intensity of WDFY fluorescence per cell (right) was measured, which reveals all PtdIns(3)P signals including aggregates as shown in diclofenac-treated cells. Data are presented as means ± SD from three independent experiments (n = 20–28 cells). *** p < 0.001 (Student’s t-test).

