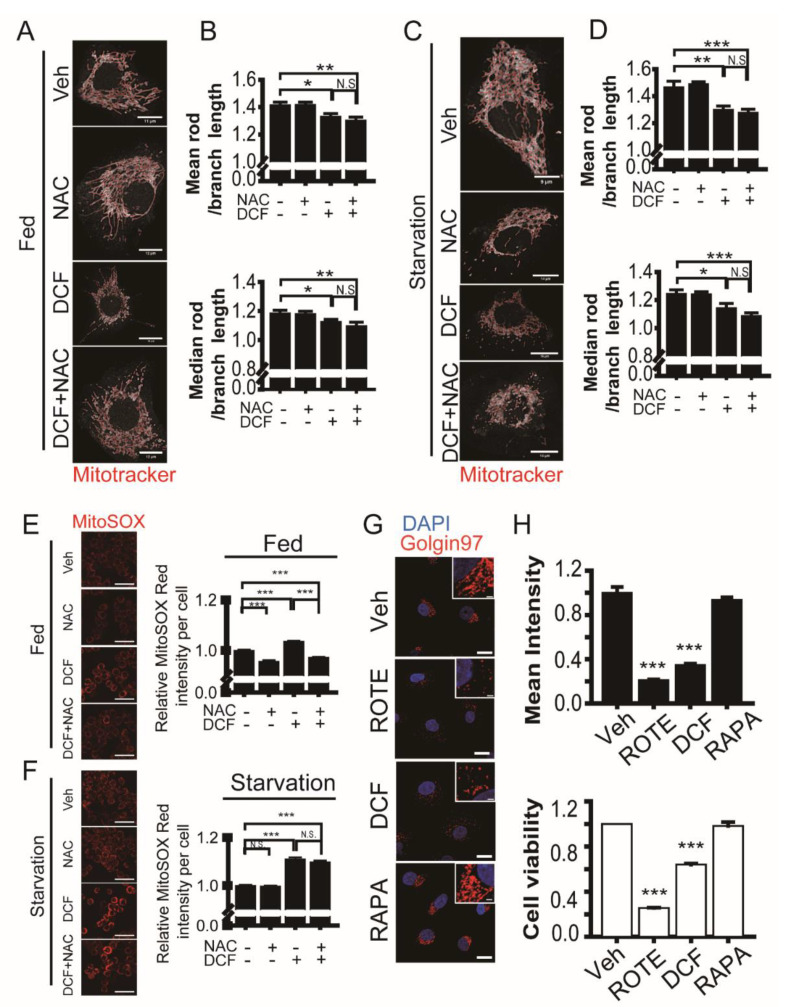
Figure 5.
Diclofenac induces fragmentation of mitochondria and the Golgi during cell death. (A,C) Fed (A, Dulbecco’s modified eagle medium, 10% fetal bovine serum) or nutrient-starved (C, Earle’s balanced salt solution) HepG2 cells were incubated in a medium containing vehicle (0.1% dimethyl sulfoxide [DMSO]), n-acetylcysteine (2 mM), diclofenac (500 µM), or diclofenac (500 µM) with n-acetylcysteine (2 mM) for 8 h. Cells were stained with Mitotracker dye to measure mitochondria morphology. Images were obtained from confocal microscopy. Red line represents mitochondrial morphological skeleton for quantification. Scale bars are shown in each image. (B,D) Quantitative analysis for mitochondrial fragmentation. Ratio of mean rod length to branch length or that of median rod length to branch length of mitochondrial skeleton network per cell was calculated using the Mitochondrial Network Analysis toolset applied with Image J. Data are presented as means ± SD from three independent experiments (n = 9–13 cells). (E,F) Detection of mitochondrial reactive oxygen species using MitoSOX red. HepG2 cells were incubated in a medium containing vehicle (0.1% DMSO), rotenone (100 µM), rapamycin (0.25 µM), or diclofenac (500 µM) for 8 h. Cells were then imaged using a high-content imaging system (ImageXpress Confocal HT.ai) and red fluorescence mean intensity per cell was quantified. Data are presented as means ± SD from three independent experiments (n = 1589–2574 cells). Scale bar, 50 µm. (G) HepG2 cells were incubated in a medium containing vehicle (0.1% DMSO), rotenone (100 µM), rapamycin (0.25 µM), or diclofenac (500 µM) for 8 h. Cells were then subjected to immunofluorescence analysis with antibodies to Golgin97 (red). Nuclei were stained with 4–6-diamidino-2-phenylindole. Images were obtained from confocal microscopy. Scale bar, 20 µm; scale bar in inset, 2 µm. (H) Relative mean intensity of Golgin97 fluorescence in the perinuclear region of the cell is presented as means ± SD from three independent experiments (upper histogram, n = 42–50 cells). Cell viability assay using a water-soluble tetrazolium salt (EZ-cytox) is presented as means ± SD from three independent experiments (lower histogram). * p < 0.05; ** p < 0.01; *** p < 0.001 (Student’s t-test).

