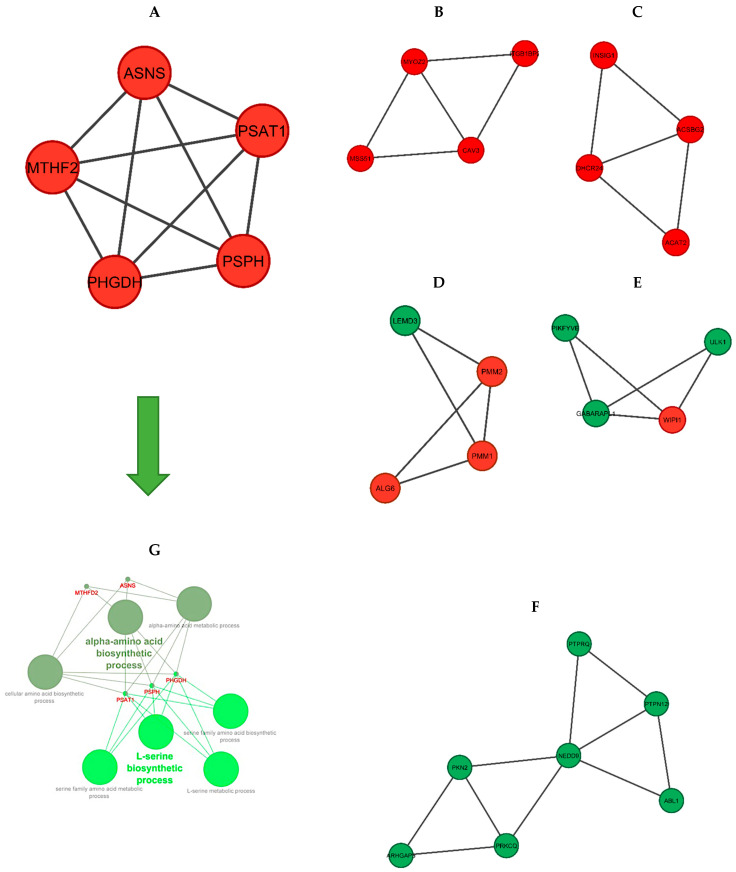
Figure 6.
The significant modules of the DEGs PPI network. (A–F): Modules 1–6. (red nodes: up-regulated genes, green nodes: down-regulated genes). (G): Functional enrichment analysis of module 1. The two green spectra represent two different gene ontologies in which the genes of this module are involved (L-serine biosynthetic process and alpha-amino acid biosynthetic process).

