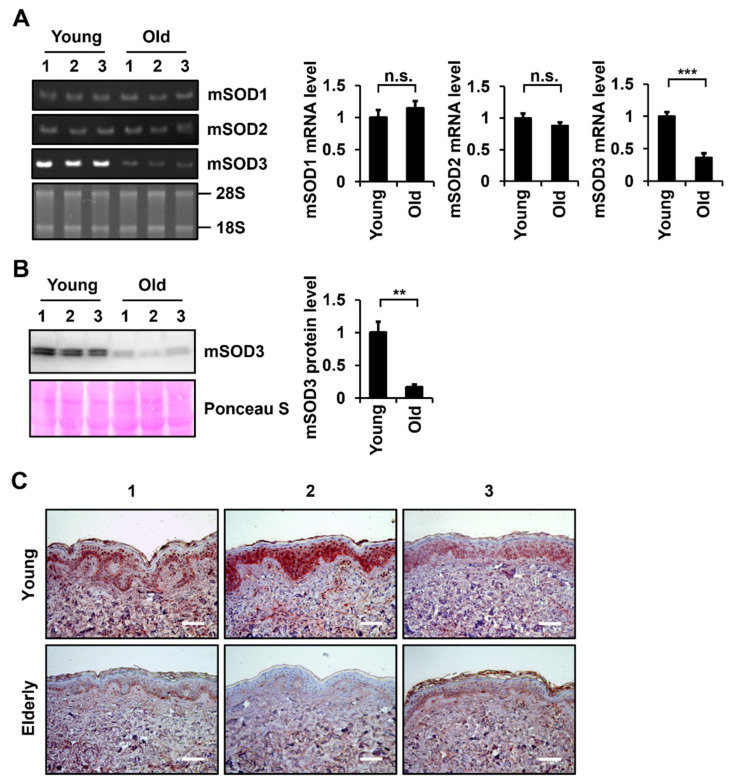
Figure 1.
Determination of the expression levels of SOD family members in young and old skin tissues of mice and humans. (A) mRNA levels of SOD1, SOD2, and SOD3 in mouse skin tissues were determined using RT-PCR. The amount of RNA was normalized by 18S and 28S RNA. (B) SOD3 protein levels in mouse skin tissues were determined via western blotting using an antibody against SOD3. The amount of protein was normalized by total protein amount using Ponceau S staining. Graphs show Sod mRNA and protein levels relative to the levels in young tissues, which were quantified using the ImageJ software. Values are presented as the means ± standard deviations (n = 3). ** p < 0.01 and *** p < 0.001 vs. young tissues. n.s.: not significant. (C) IHC analysis of SOD3 protein levels in young and elderly human skin tissues (n = 3 each). Sections of skin tissues were stained with SOD3 antibody and horseradish peroxidase-conjugated secondary antibody with 3-amino-9-ethylcarbazole, and counterstained with hematoxylin. Magnification, ×200. Bar = 100 µm.

