Figure 1.
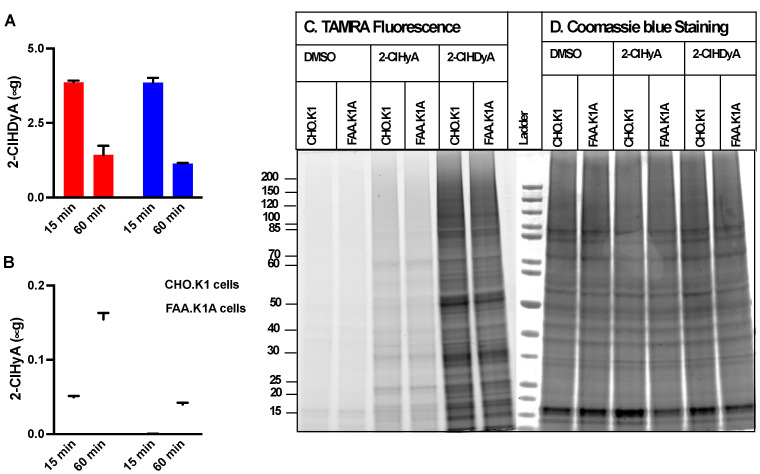
2-ClHDyA metabolism and protein modification in CHO.K1 and FAA.K1A cells. CHO.K1 and FAA.K1A cell lines were treated with 10 μM 2-ClHDyA for indicated time intervals. At the end of each time point, cellular and media lipids were extracted together, and 2-ClHDyA (A) and 2-ClHyA (B) were quantitated as described in Section 2. Values are average + SEM for n = 3 in both (A,B); (C) CHO.K1 and FAA.K1A cells were treated with either DMSO, 10 μM 2-ClHyA, or 10 μM 2-ClHDyA for 1 h at 37 °C. Proteins modified by these ω-alkyne chlorolipids were clicked with TAMRA-azide and were visualized after gel electrophoresis; (D) Coomassie blue staining of gel protein loads used for TAMRA fluorescence analyses.

