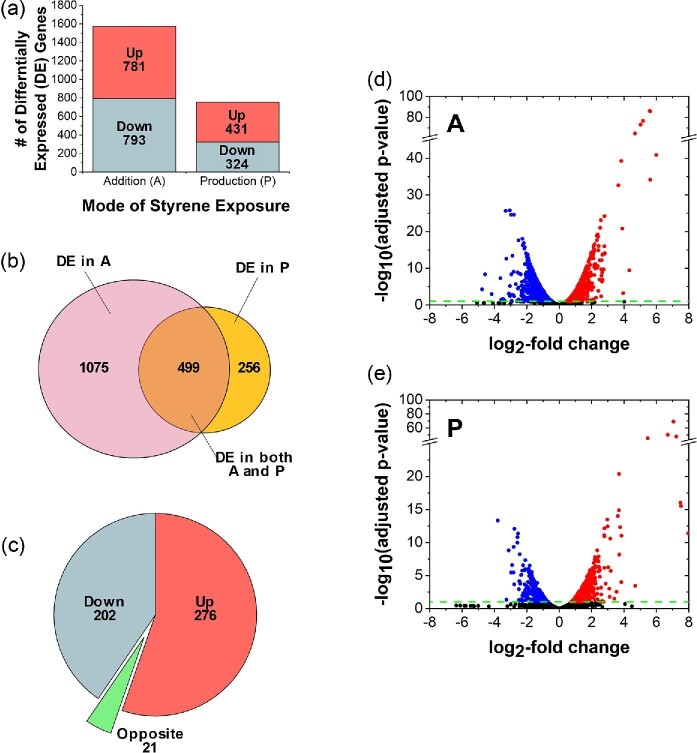
Fig. 1.
(a) Total differentially expressed (DE) genes identified for styrene addition (A) and production (P), both relative to a no styrene control (C). Upper (red) and lower (blue) bars, along with associated inset values, show total DE genes up-regulated or down-regulated, respectively. (b) A Venn diagram (created with BioVenn; Hulsen et al., 2008) comparing DE genes unique to A (maroon, left) versus unique to P (gold, right), as well as DE genes common to both conditions (orange, middle). (c) For DE genes common to both A and P, the number of genes down-regulated under both conditions (blue), up-regulated under both conditions (red), and oppositely DE (green) are compared. Note: for (a)–(c), only DE genes with FDR adjusted p-value < .1 are included. Volcano plots of all DE genes (down-regulated, blue; up-regulated, red; no significant differential expression, black) identified in the case of (D) styrene addition (A) or (E) styrene production (P), with a significance threshold of FDR adjusted p-value < .1 (green dotted line).

