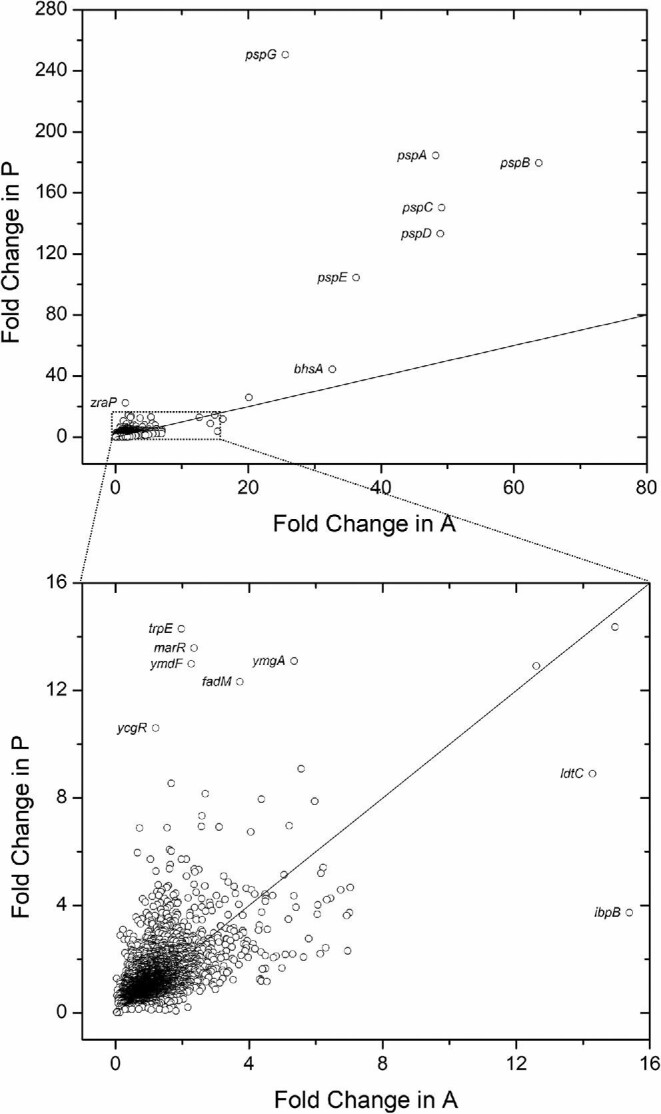
Fig. 2.

Fold change of 3 986 E. coli genes for styrene production (P) versus styrene addition (A), both relative to the no styrene control (C). Each circle represents a different gene while the solid line represents y = x. The lower graph represents an inset of the complete dataset, the region of which is depicted via a dashed box in the upper graph.
