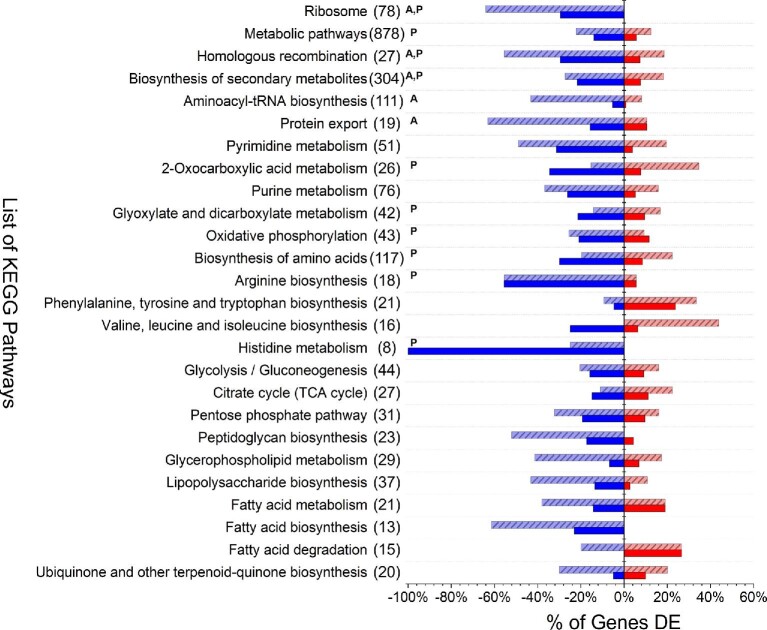
Fig. 4.
Comparison of DE genes identified for styrene addition (A) and styrene production (P) across a selection of KEGG pathways of notable significance and/or particular interest to this study. For each KEGG pathway, the total number of associated E. coli genes is listed in parenthesis. The y-axis indicates the percentage of total genes in each KEGG pathway that were significantly down-regulated (lower, blue) or up-regulated (upper, red) for A (light red or blue with stripes) and P (solid dark red or blue). Superscript ‘A’ and/or ‘P’ indicates that the entire KEGG pathway was significantly over-represented (p-value < .05) for that condition, as compared to the E. coli genome.

