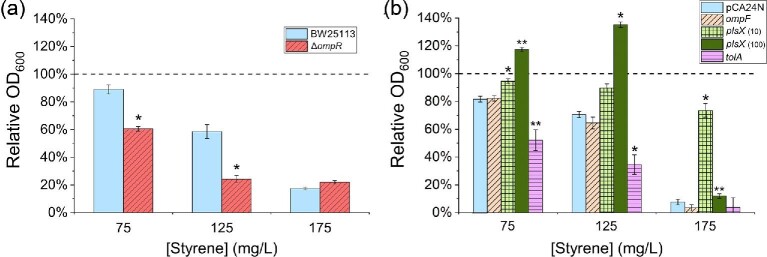
Fig. 6.
(a) Relative growth of wild-type E. coli BW25113 (control; solid, light blue) and the BW25113 ΔompR mutant (red, striped). (b) Relative growth of BW25113 harbouring pCA24N plasmid (control; solid, light blue) BW25113 harbouring appropriate plasmids used to overexpress ompF (10 µM IPTG; diagonal striped, beige), plsX (10 and 100 µM IPTG; light green, checkered and dark green, dotted, respectively) and tolA (10 µM IPTG; horizontal striped, pink). For (a) and (b), OD600 were measured following 6 hr of exposure to 75, 125, or 175 mg/l styrene, each relative to a no styrene control. Error bars reported at one standard deviation (n = 3). Dashed lines indicate relative growth of 100% (i.e. no growth difference in the presence versus absence of styrene). * indicates p < .001 and ** indicates p < .005 for two-tailed Student's t-test when compared to the respective control strain (BW25113 or BW25113 pCA24N) at the equivalent concentrations of styrene.

