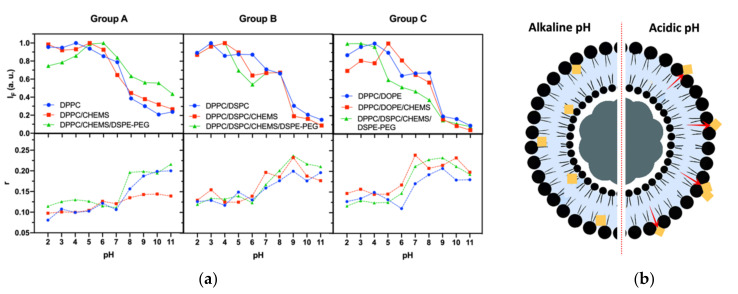
Figure 6.
(a) Fluorescence intensity and steady-state fluorescence anisotropy (r) variation with pH (from 2 to 11) of DOX-loaded SMLs based on different lipid formulations. Total lipid concentration: 1 mM; DOX: 2 µM. (b) Schematic representation of DOX molecules localization in the lipid bilayer at different pH (predictive for formulations with DPPC as the base lipid).

