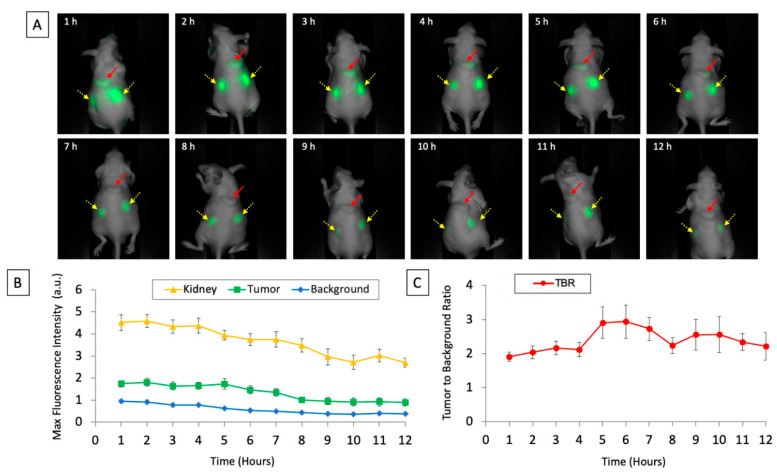
Figure 1.
(A) Images of subcutaneously implanted patient-derived xenografts of pancreatic cancer after intravenous injection of aCEA-nb800 over the 12 timepoints measured using the LICOR Pearl small animal imager. The red arrow indicates the tumor and the yellow arrows with dashed lines indicate the kidneys. (B) Maximal fluorescence intensity of tumor, kidney, and background plotted over time. (C) Calculated tumor-to-background ratio from the tumor is plotted over time. Error bars indicate standard error.

