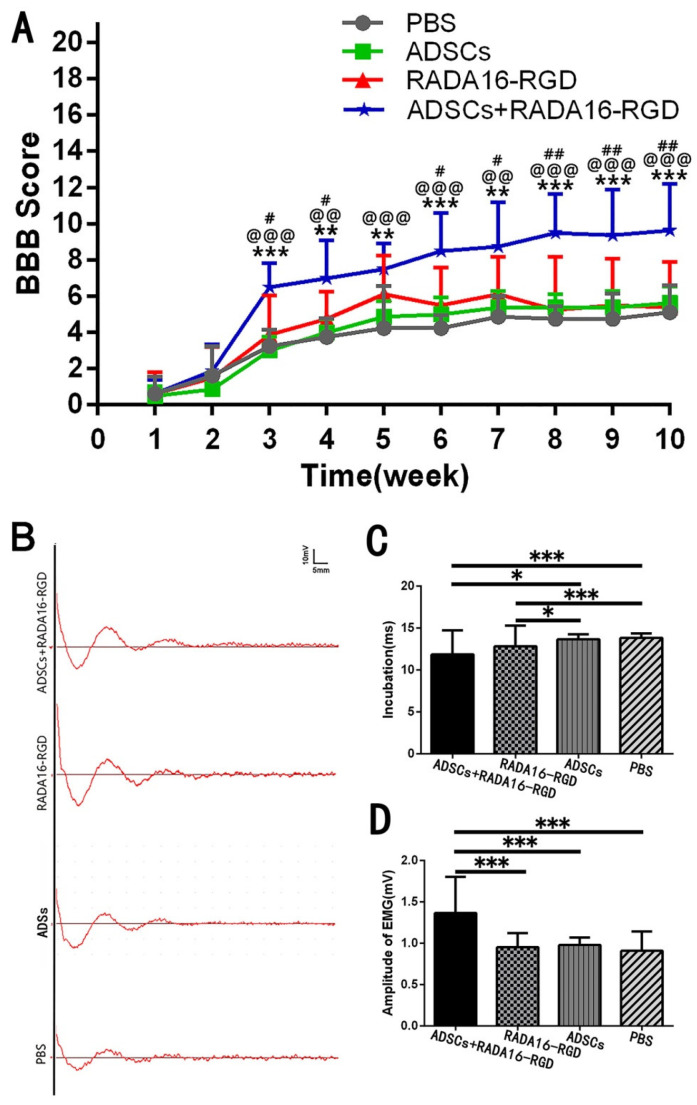
Figure 3.
ADSCs+RADA16-RGD transplantation improves motor function in rats. (A) BBB scores for 10 consecutive weeks after spinal cord injury. At weeks 1 and 2, when compared with those for the RADA16-RGD group and PBS group, the BBB scores for the ADSCs+RADA16-RGD group showed no significant difference. From 3 to 10 weeks, the ADSCs+RADA16-RGD group’s BBB score increased significantly when compared with those of the PBS, ADSCs, and RADA16-RGD groups (ADSCs+RADA16-RGD vs. PBS: p < 0.01 after 4, 5, and 7 weeks, p < 0.001 after 3, 6, 8, 9, and 10 weeks; ADSCs+RADA16-RGD vs. ADSCs: p < 0.01 after 4 and 7 weeks, p < 0.001 after 3, 5, 6, 8, 9, and 10 weeks; ADSCs+RADA16-RGD vs. RADA16-RGD: p < 0.05 after 3, 4, 6, and 7 weeks, p < 0.01 after 8, 9, and 10 weeks). # ADSCs+RADA16-RGD vs. RADA16-RGD, @ ADSCs+RADA16-RGD vs. ADSCs, * ADSCs+RADA16-RGD vs. PBS. (B) MEP records at 8 weeks after transplantation. (C) Myoelectric detection indicated that the latency was shorter in the ADSCs+RADA16-RGD and RADA16-RGD groups than in the PBS and ADSCS groups (ADSCs+RADA16-RGD vs. RADA16-RGD: p < 0.001, ADSCs+RADA16-RGD vs. ADSCs: p < 0.05, RADA16-RGD vs. RADA16-RGD: p < 0.001, RADA16-RGD vs. ADSCs: p < 0.05). (D) The amplitude was significantly higher in the ADSCs+RADA16-RGD group than in the PBS, ADSCs, and RADA16-RGD groups (ADSCs+RADA16-RGD vs. PBS: p < 0.001, ADSCs+RADA16-RGD vs. ADSCs: p < 0.001, ADSCs+RADA16-RGD vs. RADA16-RGD: p < 0.001). Data are presented as mean ± SEM (BBB: n = 8 per groups, MEP: n = 4 per groups). # p < 0.05, ## p < 0.01, @@ p < 0.01, @@@ p < 0.001, ** p < 0.01, *** p < 0.001. Data are presented as mean ± SEM (BBB score n = 8 per group, MEP n = 4 per group). ADSCs: adipose stem cells; BBB: Basso, Beattie, and Bresnahan scale; MEP: motor-evoked potential; EMG: electromyogram.

