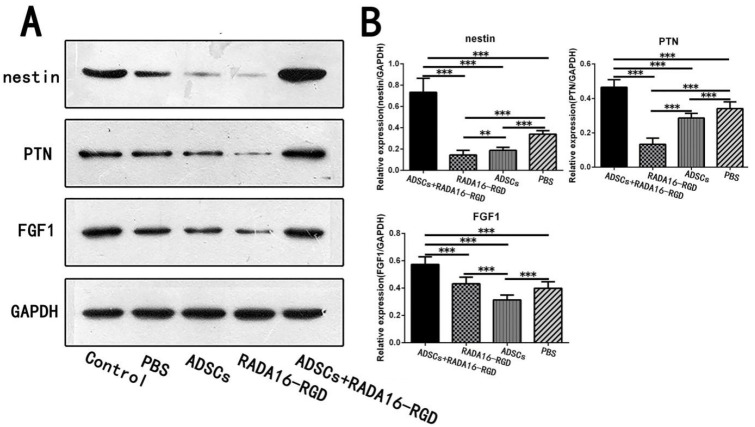
Figure 11.
Expression of the selected proteins in week 2 as assessed by Western blotting. (A) Expression of nestin, FGF1, and PTN proteins in the second week by Western blotting. (B) Quantification of the relative protein expression. The expression of nestin in the ADSCs+RADA16-RGD group was significantly higher than that in the PBS, ADSCs, and RADA16-RGD groups (ADSCs+RADA16-RGD vs. PBS or ADSCs or RADA16-RGD: p < 0.001), while it was significantly lower in the RADA16-RGD group than in the ADSCs and PBS groups (RADA16-RGD vs. ADSCs: p < 0.01, RADA16-RGD vs. PBS: p < 0.001), and significantly lower in the ADSCs group compared to the PBS group (ADSCs vs. PBS: p < 0.001). The expression of PTN was significantly higher in the ADSCs+RADA16-RGD group than in the PBS, ADSCs, and RADA16-RGD groups (ADSCs+RADA16-RGD vs. PBS or ADSCs or RADA16-RGD: p < 0.001), significantly lower in the RADA16-RGD group than in the ADSCs and PBS groups (RADA16-RGD vs. ADSCs or PBS: p < 0.001), and significantly lower in the ADSCs group than in in the PBS group (ADSCs vs. PBS: p < 0.001). The expression of FGF1 was significantly higher in the ADSCs+RADA16-RGD group than that in the PBS, ADSCs, and RADA16-RGD groups (ADSCs+RADA16-RGD vs. PBS or ADSCs or RADA16-RGD: p < 0.001), and significantly lower in the ADSCs group than that in the RADA16-RGD and PBS groups (ADSCs vs. PBS or RADA16-RGD: p < 0.001). ** p < 0.01, *** p < 0.001. Data are presented as mean ± SEM (n = 3 per group). ADSCs: adipose stem cells; FGF1: fibroblast growth factor 1; PTN: pleiotrophin; GAPDH: glyceraldehyde-3phosphate dehydrogenase.

